
UPS
United Parcel Service Inc
- Overview
- Forecast
- Valuation
- Earnings

Line
|

Candle
1D
5D
1M
3M
6M
YTD
1Y
5Y
High
86.980
Open
86.800
VWAP
86.24
Vol
6.33M
Mkt Cap
73.04B
Low
85.726
Amount
546.04M
EV/EBITDA(TTM)
7.42
Total Shares
855.56M
EV
91.97B
EV/OCF(TTM)
12.30
P/S(TTM)
0.82
United Parcel Service, Inc. provides a range of integrated logistics solutions for customers in more than 200 countries and territories. Its segments include U.S. Domestic Package and International Package. U.S. Domestic Package segment offers a range of United States domestic air and ground package transportation services. Its air portfolio offers time-definite, same-day, next-day, two-day and three-day delivery alternatives as well as air cargo services. Its ground network enables customers to ship using its day-definite ground service. UPS SurePost provides residential ground service for customers with non-urgent, lightweight residential shipments. International Package segment consists of its small package operations in Europe, Indian sub-continent, Middle East and Africa, Canada and Latin America and Asia. It offers a selection of guaranteed day- and time-definite international shipping services. Its supply chain solutions consist of forwarding, logistics, and other businesses.
Show More
Market Estimates
Earnings Estimates
Revenue
YoY Chg
EPS
YoYChg
FY2026Q1
FY2025Q4
FY2025Q3
20.99B
-2.37%
1.477
-0.88%
23.91B
-5.49%
2.138
-22.24%
20.89B
-6.11%
1.363
-22.57%
Estimates Revision
The market is revising Downward the revenue expectations for United Parcel Service, Inc. (UPS) for FY2025, with the revenue forecasts being adjusted by -0.27% over the past three months. During the same period, the stock price has changed by -8.06%.
Revenue Estimates for FY2025
Revise Downward

-0.27%
In Past 3 Month
EPS Estimates for FY2025
Revise Downward

-0.71%
In Past 3 Month
Stock Price
Go Down

-8.06%
In Past 3 Month
20 Analyst Rating

31.07% Upside
Wall Street analysts forecast UPS stock price to rise over the next 12 months. According to Wall Street analysts, the average 1-year price target for UPS is 113.05 USD with a low forecast of 90.00 USD and a high forecast of 133.00 USD. However, analyst price targets are subjective and often lag stock prices, so investors should focus on the objective reasons behind analyst rating changes, which better reflect the company's fundamentals.
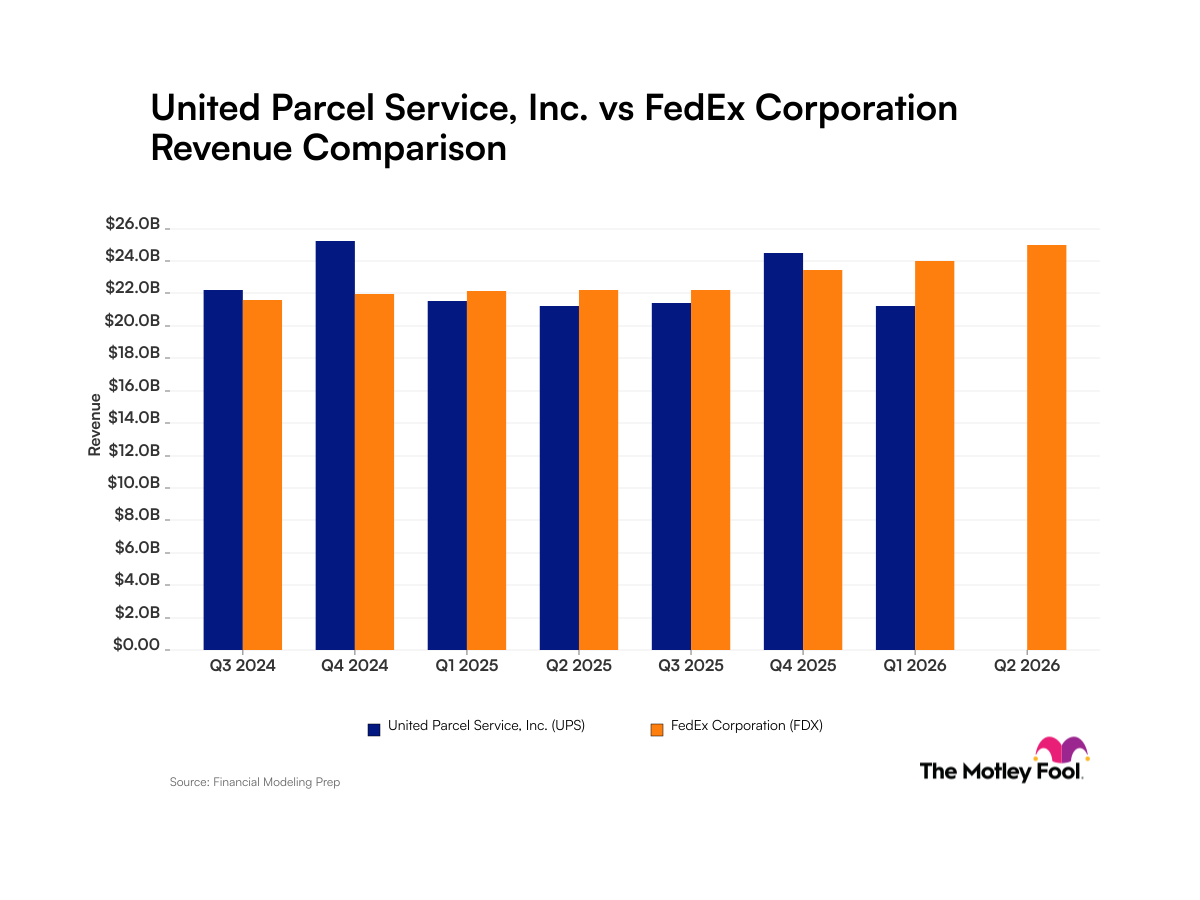
10 Buy
9 Hold
1 Sell
Moderate Buy

31.07% Upside
Current: 86.250

Low
90.00
Averages
113.05
High
133.00

31.07% Upside
Current: 86.250

Low
90.00
Averages
113.05
High
133.00
Vertical Research
Jeffrey Kauffman
Buy
to
Hold
downgrade
$103
2025-07-30
Reason
Vertical Research
Jeffrey Kauffman
Price Target
$103
2025-07-30
downgrade
Buy
to
Hold
Reason
Vertical Research analyst Jeffrey Kauffman downgraded UPS to Hold from Buy with a $103 price target.
UBS
Thomas Wadewitz
Buy
downgrade
$124 -> $118
2025-07-30
Reason
UBS
Thomas Wadewitz
Price Target
$124 -> $118
2025-07-30
downgrade
Buy
Reason
UBS analyst Thomas Wadewitz lowered the firm's price target on UPS to $118 from $124 and keeps a Buy rating on the shares. UPS's in-line Q2 EPS reflected favorable execution managing down costs in Domestic Package, but the forward outlook appears more challenging because the impact to domestic SMB customers who may have sourced goods from China is unclear, the analyst tells investors in a research note.
Stifel
Buy
downgrade
$124 -> $120
2025-07-30
Reason
Stifel
Price Target
$124 -> $120
2025-07-30
downgrade
Buy
Reason
Stifel lowered the firm's price target on UPS to $120 from $124 and keeps a Buy rating on the shares. Management pulled 2025 guidance and "beyond that, there was a lot to digest from the quarter," the analyst tells investors. However, the firm views most of the negatives as addressable or being addressed, especially given its expectations for a firming market backdrop, so it remains constructive on the stock.
Susquehanna
Neutral
downgrade
$110 -> $100
2025-07-30
Reason
Susquehanna
Price Target
$110 -> $100
2025-07-30
downgrade
Neutral
Reason
Susquehanna lowered the firm's price target on UPS (UPS) to $100 from $110 and keeps a Neutral rating on the shares. The firm said the company continues to face the difficult challenge of shrinking to grow in a high-fixed-cost network business with organic of macro and tariffs, and customer-specific (Amazon) volume pressure.
Oppenheimer
Scott Schneeberger
Outperform
maintain
$114 -> $100
2025-07-30
Reason
Oppenheimer
Scott Schneeberger
Price Target
$114 -> $100
2025-07-30
maintain
Outperform
Reason
Oppenheimer analyst Scott Schneeberger lowered the firm's price target on UPS to $100 from $114 and keeps an Outperform rating on the shares. The firm notes that Q2 revenue slightly outperformed, while adjusted operating income/margin/EPS were below expectations. UPS again abstained from providing a 2025 revenue/operating profit outlook pending more certainty in the macro environment. Related to trade, UPS's China-U.S. lane declined 35% in May/June and experienced margin pressure due to light Ground Saver volume, Oppenheimer adds.
Morgan Stanley
Underweight
downgrade
$80 -> $75
2025-07-30
Reason
Morgan Stanley
Price Target
$80 -> $75
2025-07-30
downgrade
Underweight
Reason
Morgan Stanley lowered the firm's price target on UPS (UPS) to $75 from $80 and keeps an Underweight rating on the shares. Q2 results came in between the firm's estimates and consensus, but Domestic results missed both and "will likely be the bigger focus for investors," the analyst contends. With the Amazon (AMZN) draw down expected to double in the second half, the firm believes there could be a bigger gap than expected for second half earnings and adds that this risk layers on top of other unknowns, including tariff policy impact, mix pressure from USPS insourcing, and an uncertain peak season.
See All Ratings
Valuation Metrics
The current forward P/E ratio for United Parcel Service Inc (UPS.N) is 12.99, compared to its 5-year average forward P/E of 16.74. For a more detailed relative valuation and DCF analysis to assess United Parcel Service Inc 's fair value, click here.
Forward PE
The forward P/E ratio is a valuation metric that divides a company's current stock price by its estimated future earnings per share over the next 12 months.

Undervalued
5Y Average PE
16.74
Current PE
12.99
Overvalued PE
19.25
Undervalued PE
14.24
Forward EV/EBITDA
The forward EV/EBITDA ratio is a valuation metric that divides a company's enterprise value (EV) by its estimated future earnings before interest, taxes, depreciation, and amortization (EBITDA) over the next 12 months.

Undervalued
5Y Average EV/EBITDA
11.23
Current EV/EBITDA
8.09
Overvalued EV/EBITDA
12.91
Undervalued EV/EBITDA
9.54
Forward PS
The forward P/S ratio is a valuation metric that divides a company's current stock price by its estimated future sales (or revenue) per share over the next 12 months.

Strongly Undervalued
5Y Average PS
1.50
Current PS
0.83
Overvalued PS
1.77
Undervalued PS
1.23
Financials
Annual
Quarterly
FY2025Q2
YoY :
-2.74%
21.22B
Total Revenue
FY2025Q2
YoY :
-9.11%
1.88B
Operating Profit
FY2025Q2
YoY :
-8.94%
1.28B
Net Income after Tax
FY2025Q2
YoY :
-7.93%
1.51
EPS - Diluted
FY2025Q2
YoY :
-173.11%
-775.00M
Free Cash Flow
FY2025Q2
YoY :
+3.89%
78.72
Gross Profit Margin - %
FY2025Q2
YoY :
-6.35%
6.05
Net Margin - %
FY2025Q2
YoY :
+10.21%
16.19
ROIC
Trading Trends
Insider
Insiders areBuying! The selling amount has increased 131.41% over the last month.
Sold
0-3
Months
0.0
USD
0
3-6
Months
0.0
USD
0
6-9
Months
0.0
USD
0
0-12
Months
0.0
USD
0
Bought
0-3
2
1.4M
USD
Months
3-6
0
0.0
USD
Months
6-9
0
0.0
USD
Months
0-12
0
0.0
USD
Months
Hedge Fund
Hedge Funds areBuying! The buying amount has increased 3861.21% over the last quarter.
Sold
0-3
Months
0.0
Volume
0
3-6
Months
63.8K
Volume
4
6-9
Months
194.3K
Volume
13
0-12
Months
0.0
Volume
0
Bought
0-3
0
0.0
Volume
Months
3-6
8
726.3K
Volume
Months
6-9
7
18.3K
Volume
Months
0-12
1
2.5K
Volume
Months
Congress Trading
Congress areSelling! The selling amount has increased245.83%over the last month.
Sold
0-3
Months
107.0K
USD
5
3-6
Months
24.0K
USD
3
6-9
Months
73.0K
USD
3
0-12
Months
32.5K
USD
1
Bought
0-3
0
0.0
USD
Months
3-6
7
56.0K
USD
Months
6-9
2
16.0K
USD
Months
0-12
4
32.0K
USD
Months
Insider
Insiders areBuying! The selling amount has increased 131.41% over the last month.
Sold
0-3
Months
0.0
USD
0
3-6
Months
0.0
USD
0
6-9
Months
0.0
USD
0
0-12
Months
0.0
USD
0
Bought
0-3
2
1.4M
USD
Months
3-6
0
0.0
USD
Months
6-9
0
0.0
USD
Months
0-12
0
0.0
USD
Months
UPS News & Events
Events Timeline
2025-07-29 (ET)
2025-07-29
09:27:26
UPS says July performance 'good,' but not a predictor of rest of quarter

2025-07-29
08:56:00
UPS says customers have not shared peak season plans

2025-07-29
06:02:37
UPS not providing revenue or operating profit guidance for FY25

Sign Up For More Events
News
8.0
08-06Yahoo FinanceUPS Announces Quarterly Dividend
2.0
08-06NASDAQ.COMMeme Stock Mania Returns & a Fantasy Stock Draft
4.5
08-04WSJTractor Supply Beefs Up Last-Mile Delivery to Grow Sales
Sign Up For More News
People Also Watch

APP
Applovin Corp
390.570
USD
+3.34%

BMY
Bristol-Myers Squibb Co
44.820
USD
-2.25%

ADI
Analog Devices Inc
220.690
USD
0.00%

CB
Chubb Ltd
269.630
USD
+0.73%

DE
Deere & Co
509.640
USD
+0.21%

FI
Fiserv Inc
134.040
USD
-0.18%

GILD
Gilead Sciences Inc
110.280
USD
-1.94%

LMT
Lockheed Martin Corp
434.850
USD
+1.54%

NKE
Nike Inc
75.480
USD
+1.48%

ADP
Automatic Data Processing Inc
301.640
USD
+0.73%
FAQ

What is United Parcel Service Inc (UPS) stock price today?
The current price of UPS is 86.25 USD — it has decreased -0.61 % in the last trading day.

What is United Parcel Service Inc (UPS)'s business?

What is the price predicton of UPS Stock?

What is United Parcel Service Inc (UPS)'s revenue for the last quarter?

What is United Parcel Service Inc (UPS)'s earnings per share (EPS) for the last quarter?

What changes have occurred in the market's expectations for United Parcel Service Inc (UPS)'s fundamentals?

How many employees does United Parcel Service Inc (UPS). have?
