EQNR Overview
-
$
0.000
0.000(0.000%)
At close0.000(0.000%)Aft-market
ET
Loading chart...

The current price of EQNR is 34.27 USD — it has increased 1.06
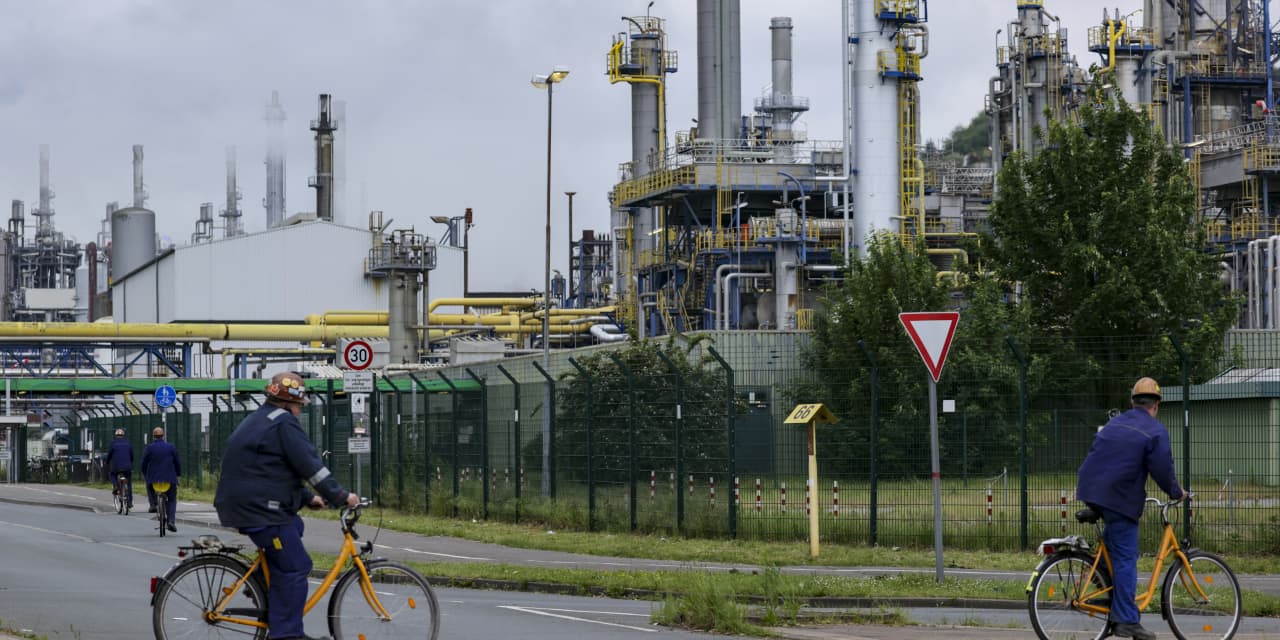
Equinor ASA, formerly Statoil ASA is a Norway-based international energy company. The Company’s purpose is to turn natural resources into energy. Equinor sells crude oil and delivers natural gas to the European market. It is also engaged in processing, refining, offshore wind and carbon capture and storage activities. Equinor ASA has five reporting segments: Exploration & Production Norway (E&P Norway), Exploration & Production International (E&P International), Exploration & Production USA (E&P USA), Marketing, Midstream & Processing (MMP) and Renewables (REN). The Company has several subsidiaries such as Equinor Nigeria Energy Company Ltd, Equinor Wind Power AS, Equinor International Netherlands BV and Equinor Brasil Energia Ltda.
Wall Street analysts forecast EQNR stock price to rise over the next 12 months. According to Wall Street analysts, the average 1-year price target for EQNR is23.89 USD with a low forecast of 22.00 USD and a high forecast of 25.79 USD. However, analyst price targets are subjective and often lag stock prices, so investors should focus on the objective reasons behind analyst rating changes, which better reflect the company's fundamentals.
Equinor ASA revenue for the last quarter amounts to 27.82B USD, decreased -5.34
Equinor ASA. EPS for the last quarter amounts to 1.24 USD, increased 27.84
Equinor ASA (EQNR) has 24620 emplpoyees as of July 08 2026.
Today EQNR has the market capitalization of 81.07B USD.