
Stock Chart Patterns
AI-powered detection of key price patterns in crypto, stocks, and ETFs. Optimize your trades with actionable insights.
Backed By Leading Global Technology Powerhouses
Master Stock Trading with AI-Powered Chart Pattern Detection
Candlestick chart analysis can be overwhelming for new traders, and without experience, it's easy to miss key patterns that signal important trends. This lack of understanding can lead to poor trading decisions, missed opportunities, and unnecessary losses. Stock Chart Patterns solves this by using AI to automatically detect key price patterns in crypto, stocks, and ETFs, simplifying the process. By highlighting actionable trends and providing clear insights, it helps beginners avoid costly mistakes and make smarter, more confident trading decisions.
How to Use Stock Chart Patterns
Start in seconds
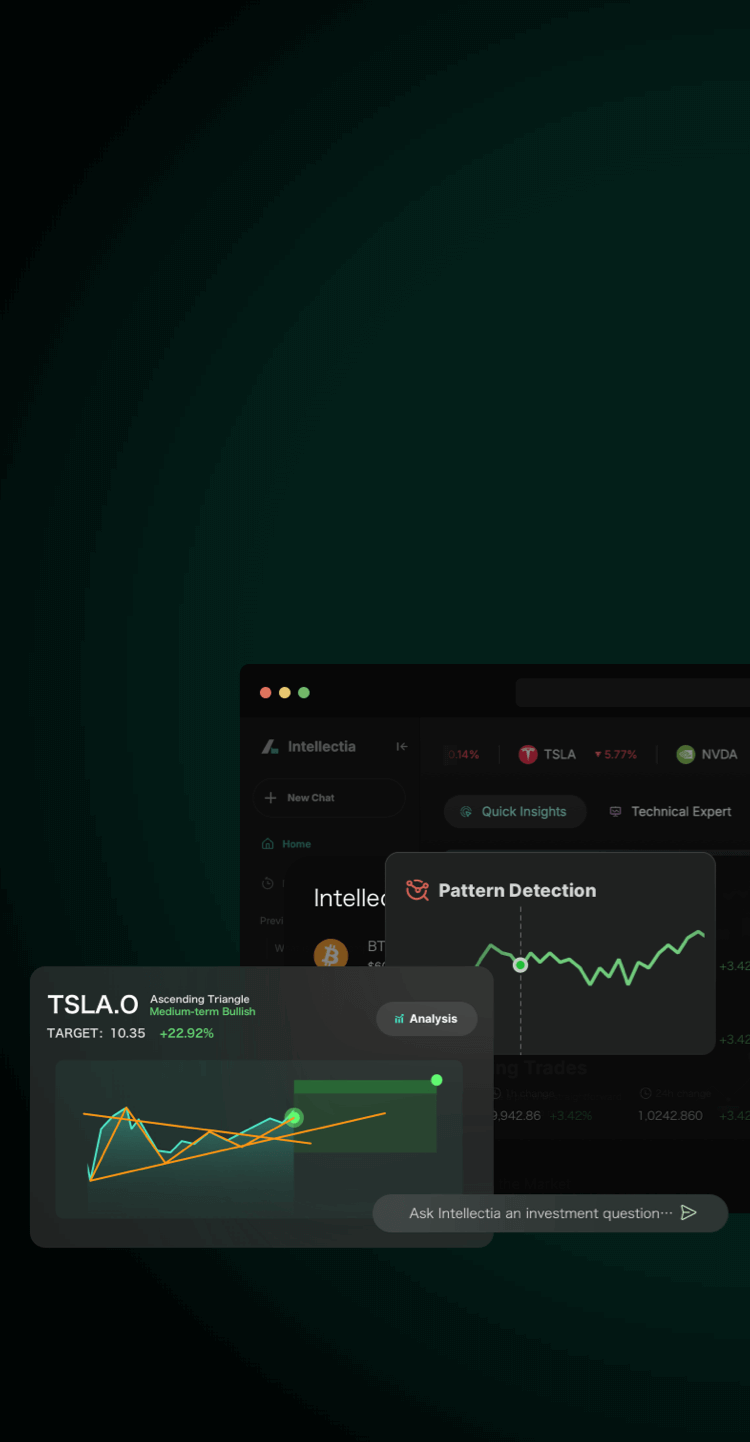
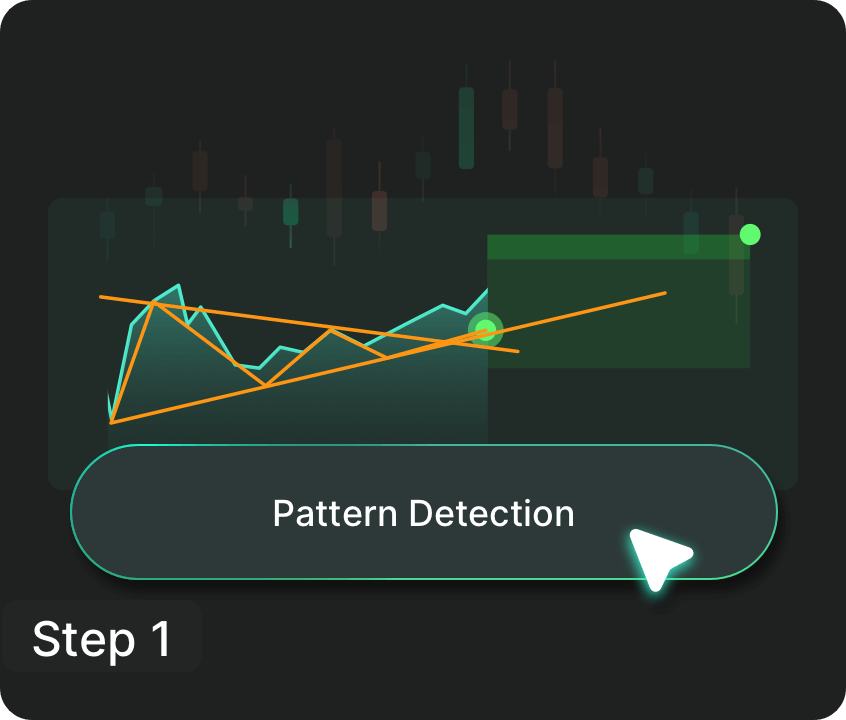
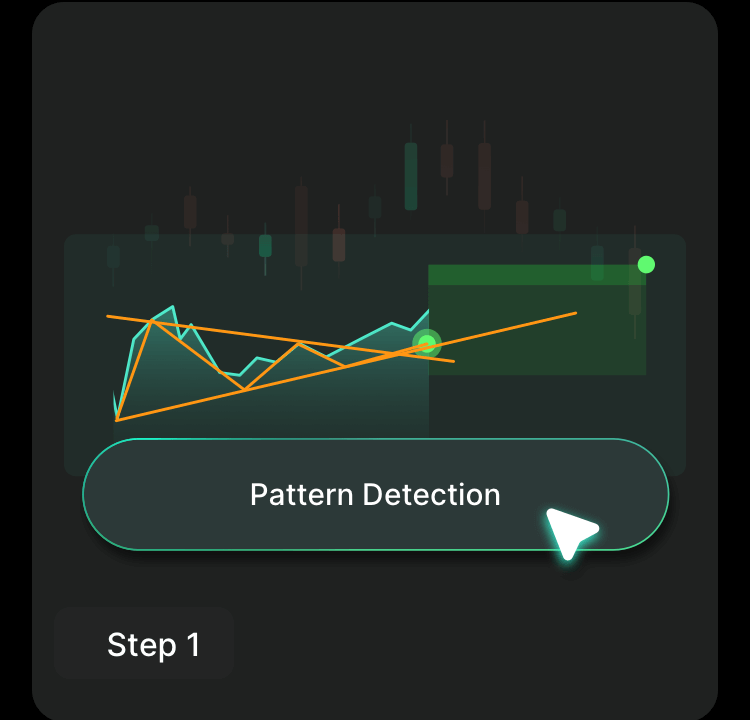
Click the "Pattern Detection" feature on the homepage to access real-time pattern formation alerts for crypto, stocks, or ETFs.
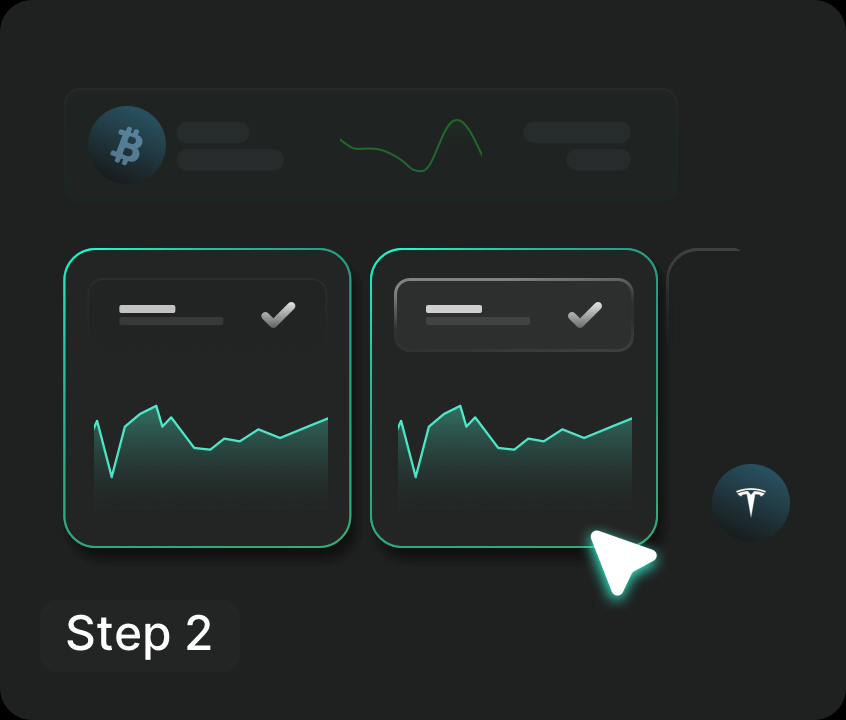
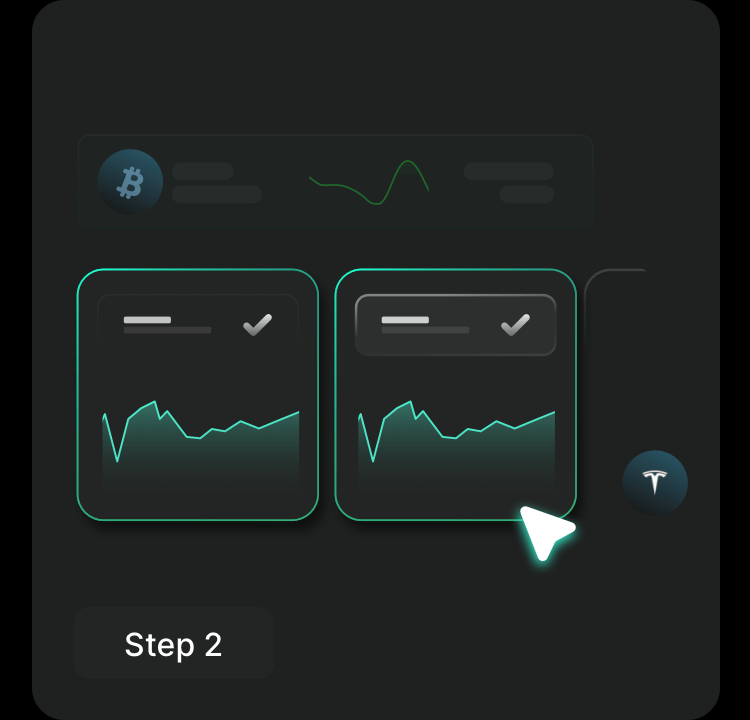
Check out the details
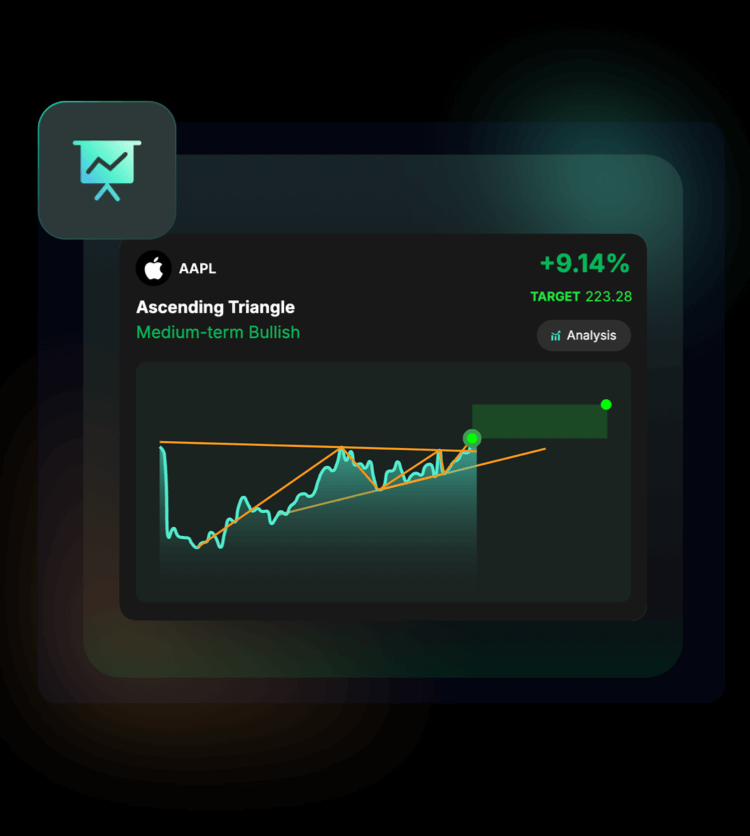
Browse the alerts and dig into each asset's chart. You'll get a quick breakdown of patterns, bullish/bearish predictions, and target prices based on current trends.
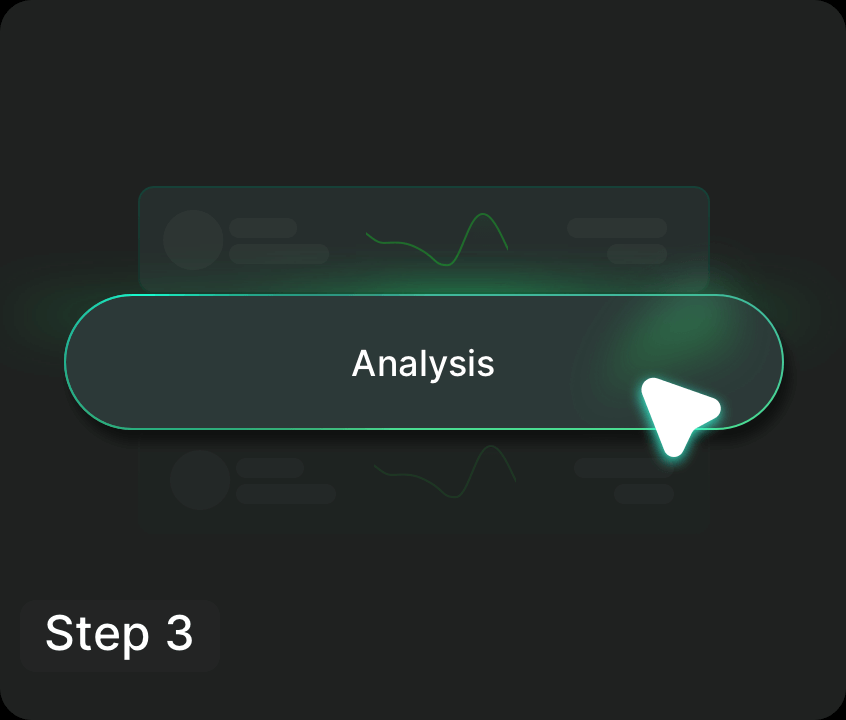
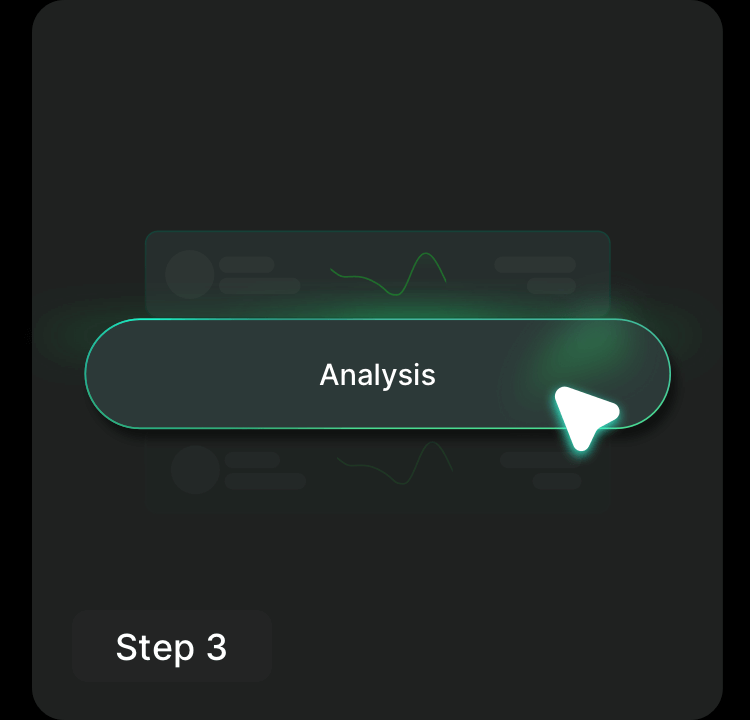
Get deeper insights
Click the "Analysis" button for more detailed insights and actionable recommendations. Refine your strategy and make confident moves with the data at your fingertips.
Use Case


Swing Traders
Align with short-term trends for better trades
Swing traders use AI Stock Picker to access smart, data-driven stock recommendations, helping them ride trends for the day and optimize their intraday profits.


Momentum Investors
Catch momentum shifts at the open
Momentum investors use AI Stock Picker to spot stocks with strong intraday movements, ensuring they capitalize on price shifts early in the day for maximum returns.


Risk-Averse Investors
Reduce volatility with smarter trading strategies
Risk-averse investors trust the Financial AI Agent to guide them toward low-risk, stable investments, keeping their portfolios balanced and less vulnerable to market fluctuations.
Why Stock Chart Patterns Stands Out
10+ High-Potential Patterns
With support for over 10 chart patterns and an average potential return of 20% after identification, Stock Chart Patterns helps you spot the most promising trade opportunities.
 Try Now
Powerful Algorithms & Real-Time Data
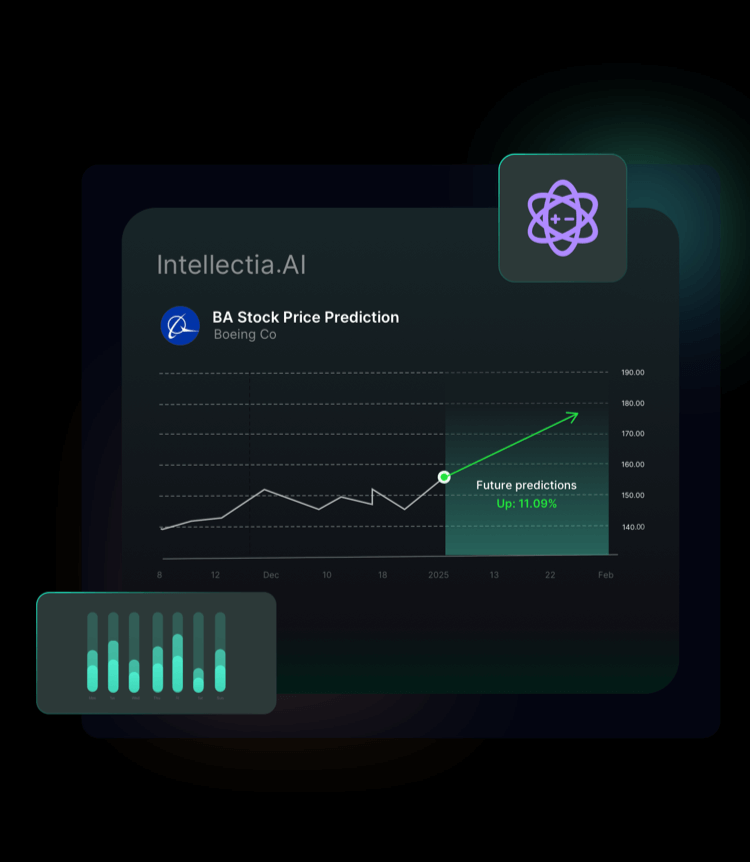
By combining advanced algorithms with real-time data analysis, this tool quickly identifies key price movements and trends. Each pattern comes with a target price and easy-to-read visuals, so you can evaluate and act fast.
 Try Now
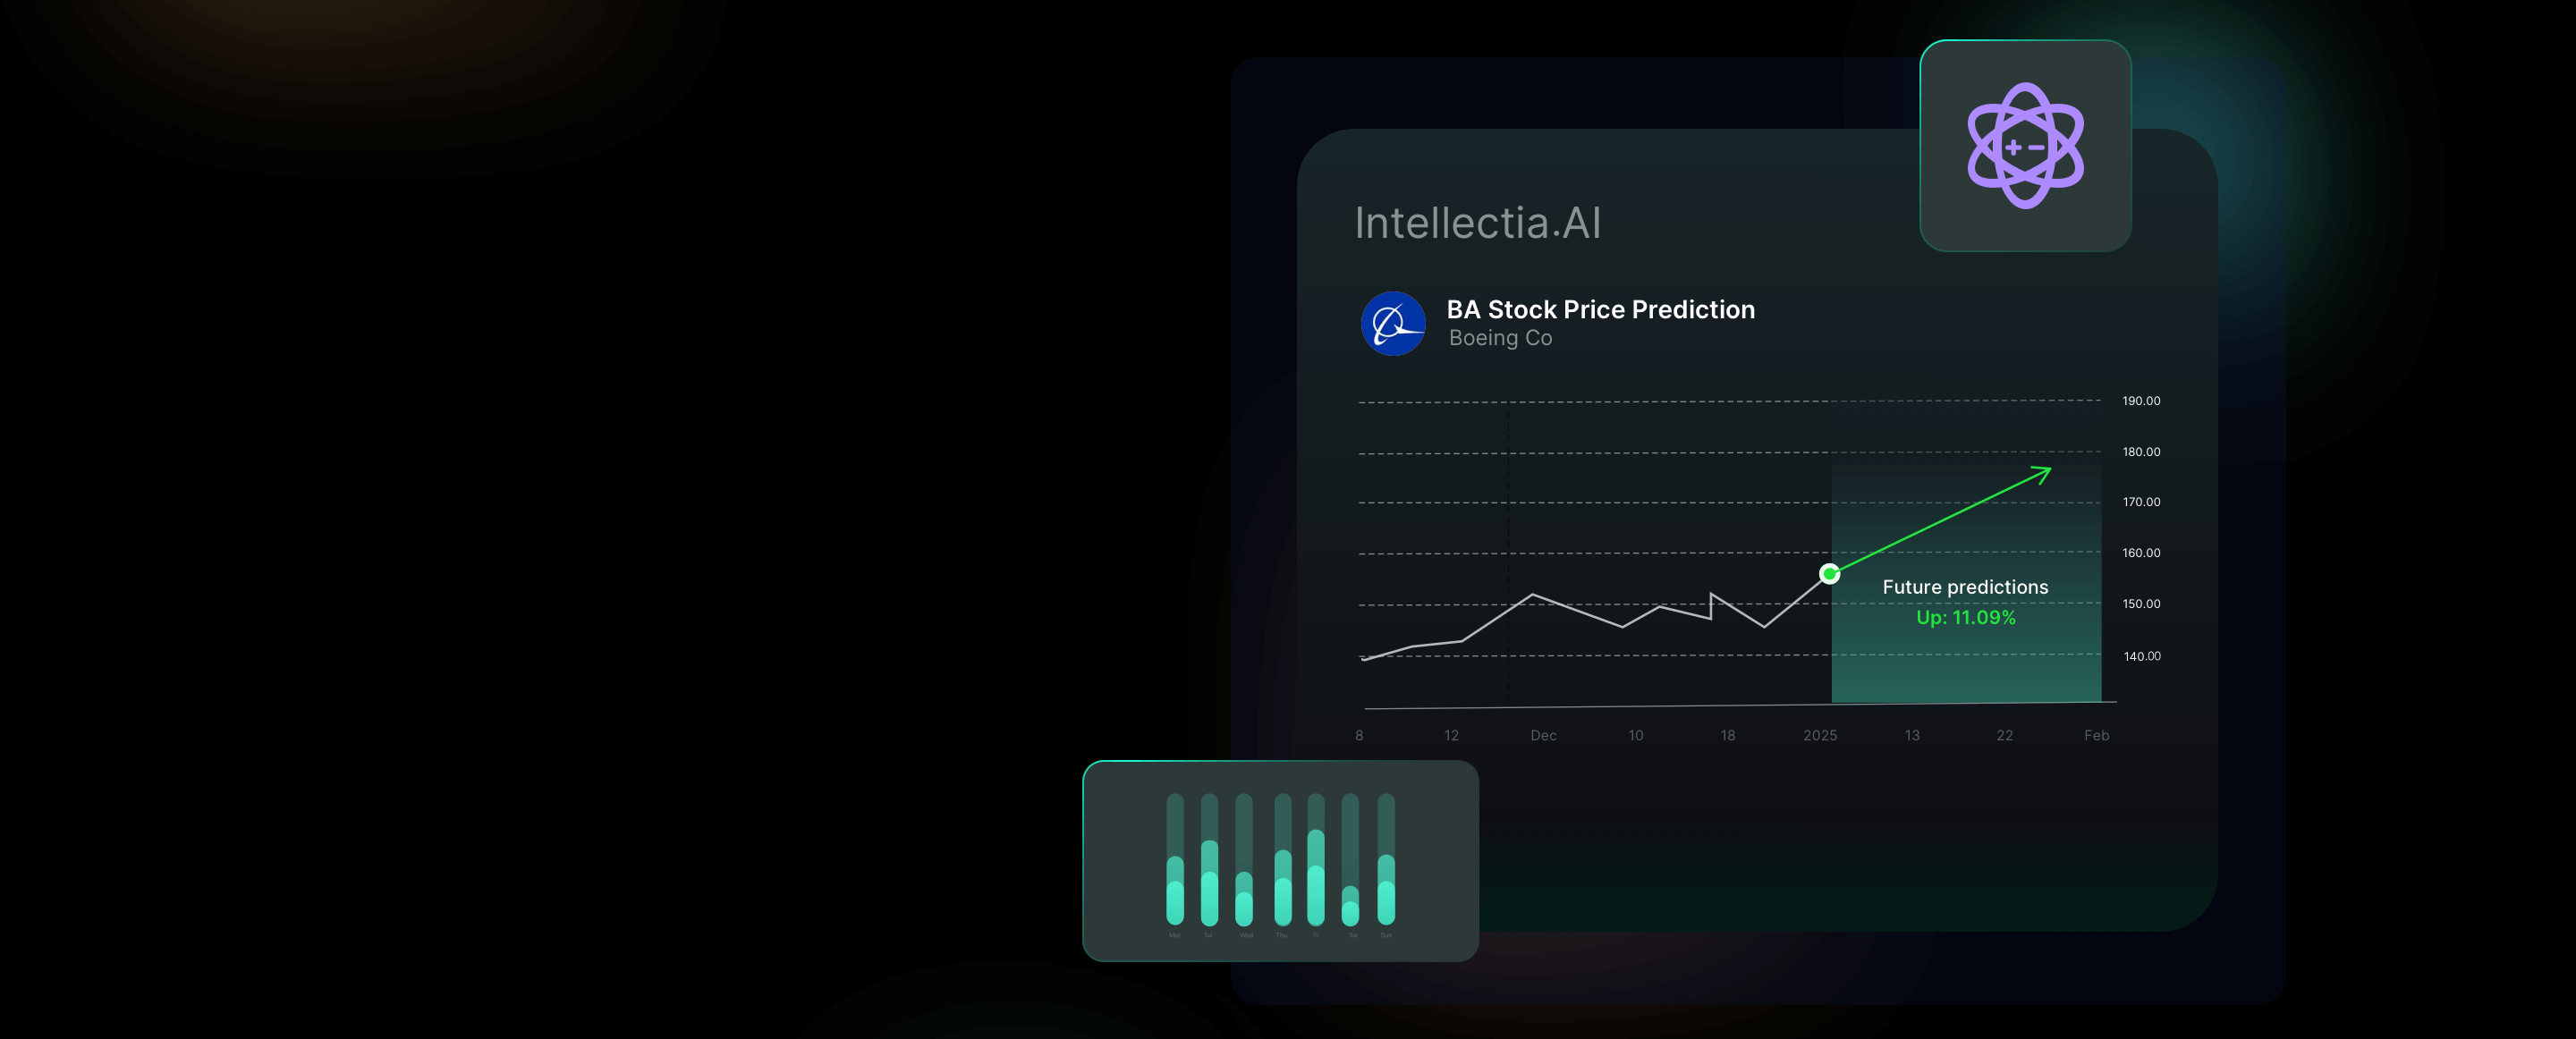
Simplified Decision-Making Across Assets
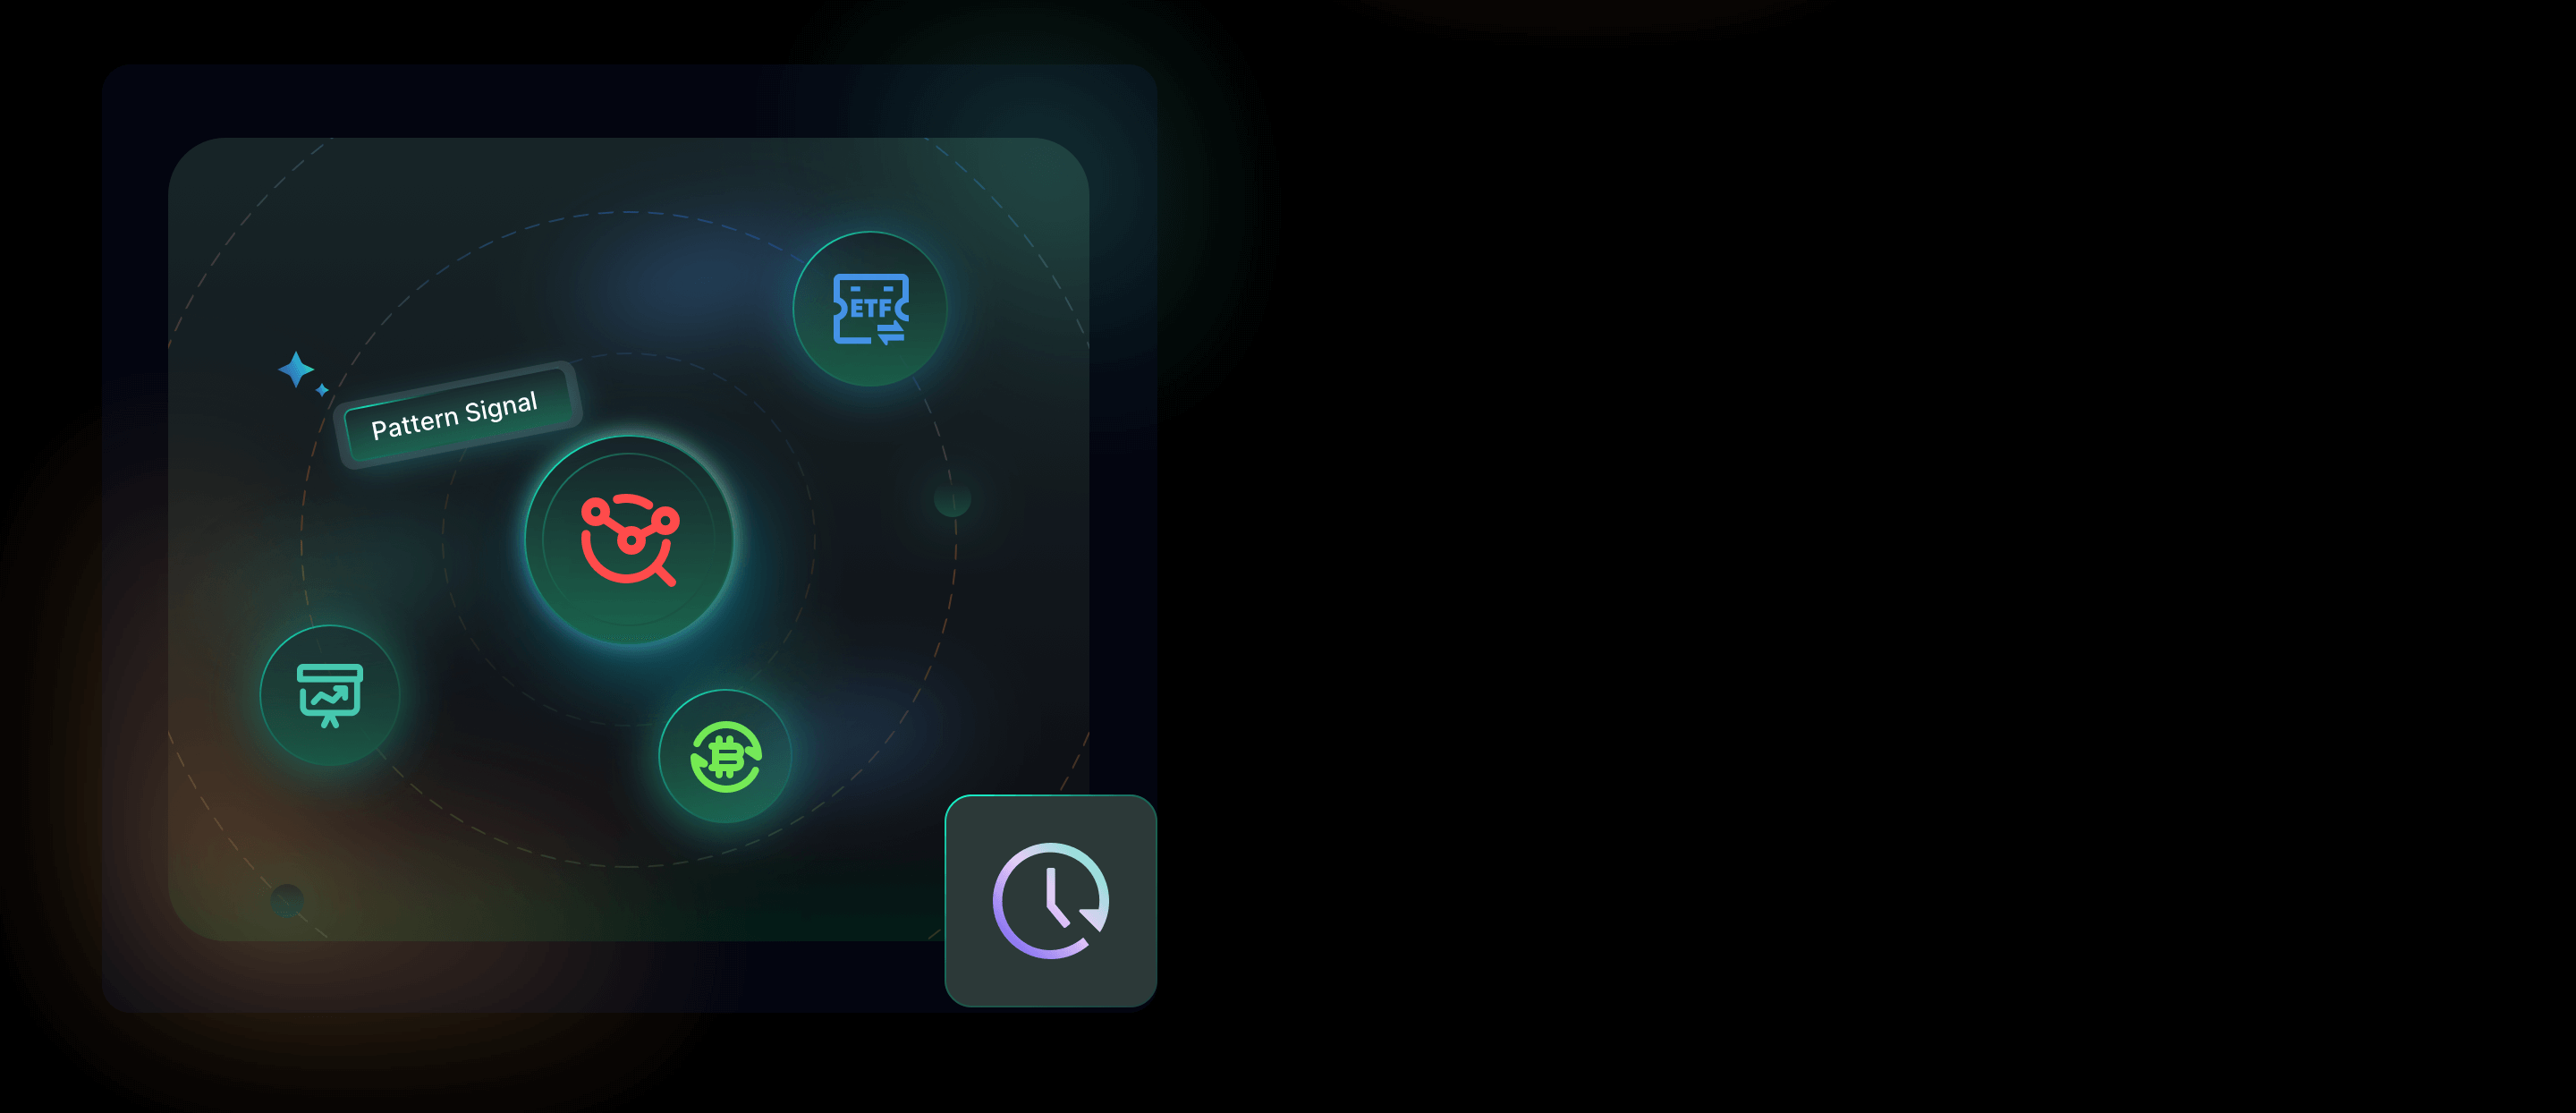
Whether you're trading crypto, stocks, or ETFs, Pattern Signal streamlines your decision-making by delivering pre-analyzed insights straight to your dashboard—helping you trade smarter and with confidence.
 Try Now
What Our Users Say
Why Choose Us

Investing That Gets You
We get it. Every investor has different needs. That's why we focus on understanding your goals, risk tolerance, and preferences, delivering recommendations that truly match your financial situation.

Stay Ahead with Real-Time Insights
The market moves fast, and so should you. Get live updates and alerts on market trends, stock activity, and key news. Our AI is always on, so you never miss an opportunity to act when it matters most.

Maximize Your Potential
With AI-driven recommendations based on real-time data, we help you find opportunities others might miss—boosting your portfolio's performance while minimizing unnecessary risks.

Covering Every Asset Class
From stocks to crypto and ETFs, we've got you covered. Diversify your investments with insights across a wide range of asset classes and create a balanced, growth-oriented portfolio.

Invest in the Future
Our AI is ahead of the curve, forecasting market shifts and spotting trends before they hit. Be ready for what's next with investment strategies designed for tomorrow's challenges.

Top-Notch Security
Your data and investments are safe with us. We use the latest security protocols to ensure your information is protected, so you can invest with peace of mind.
Frequently Asked Questions
What is the Pattern Signal feature?
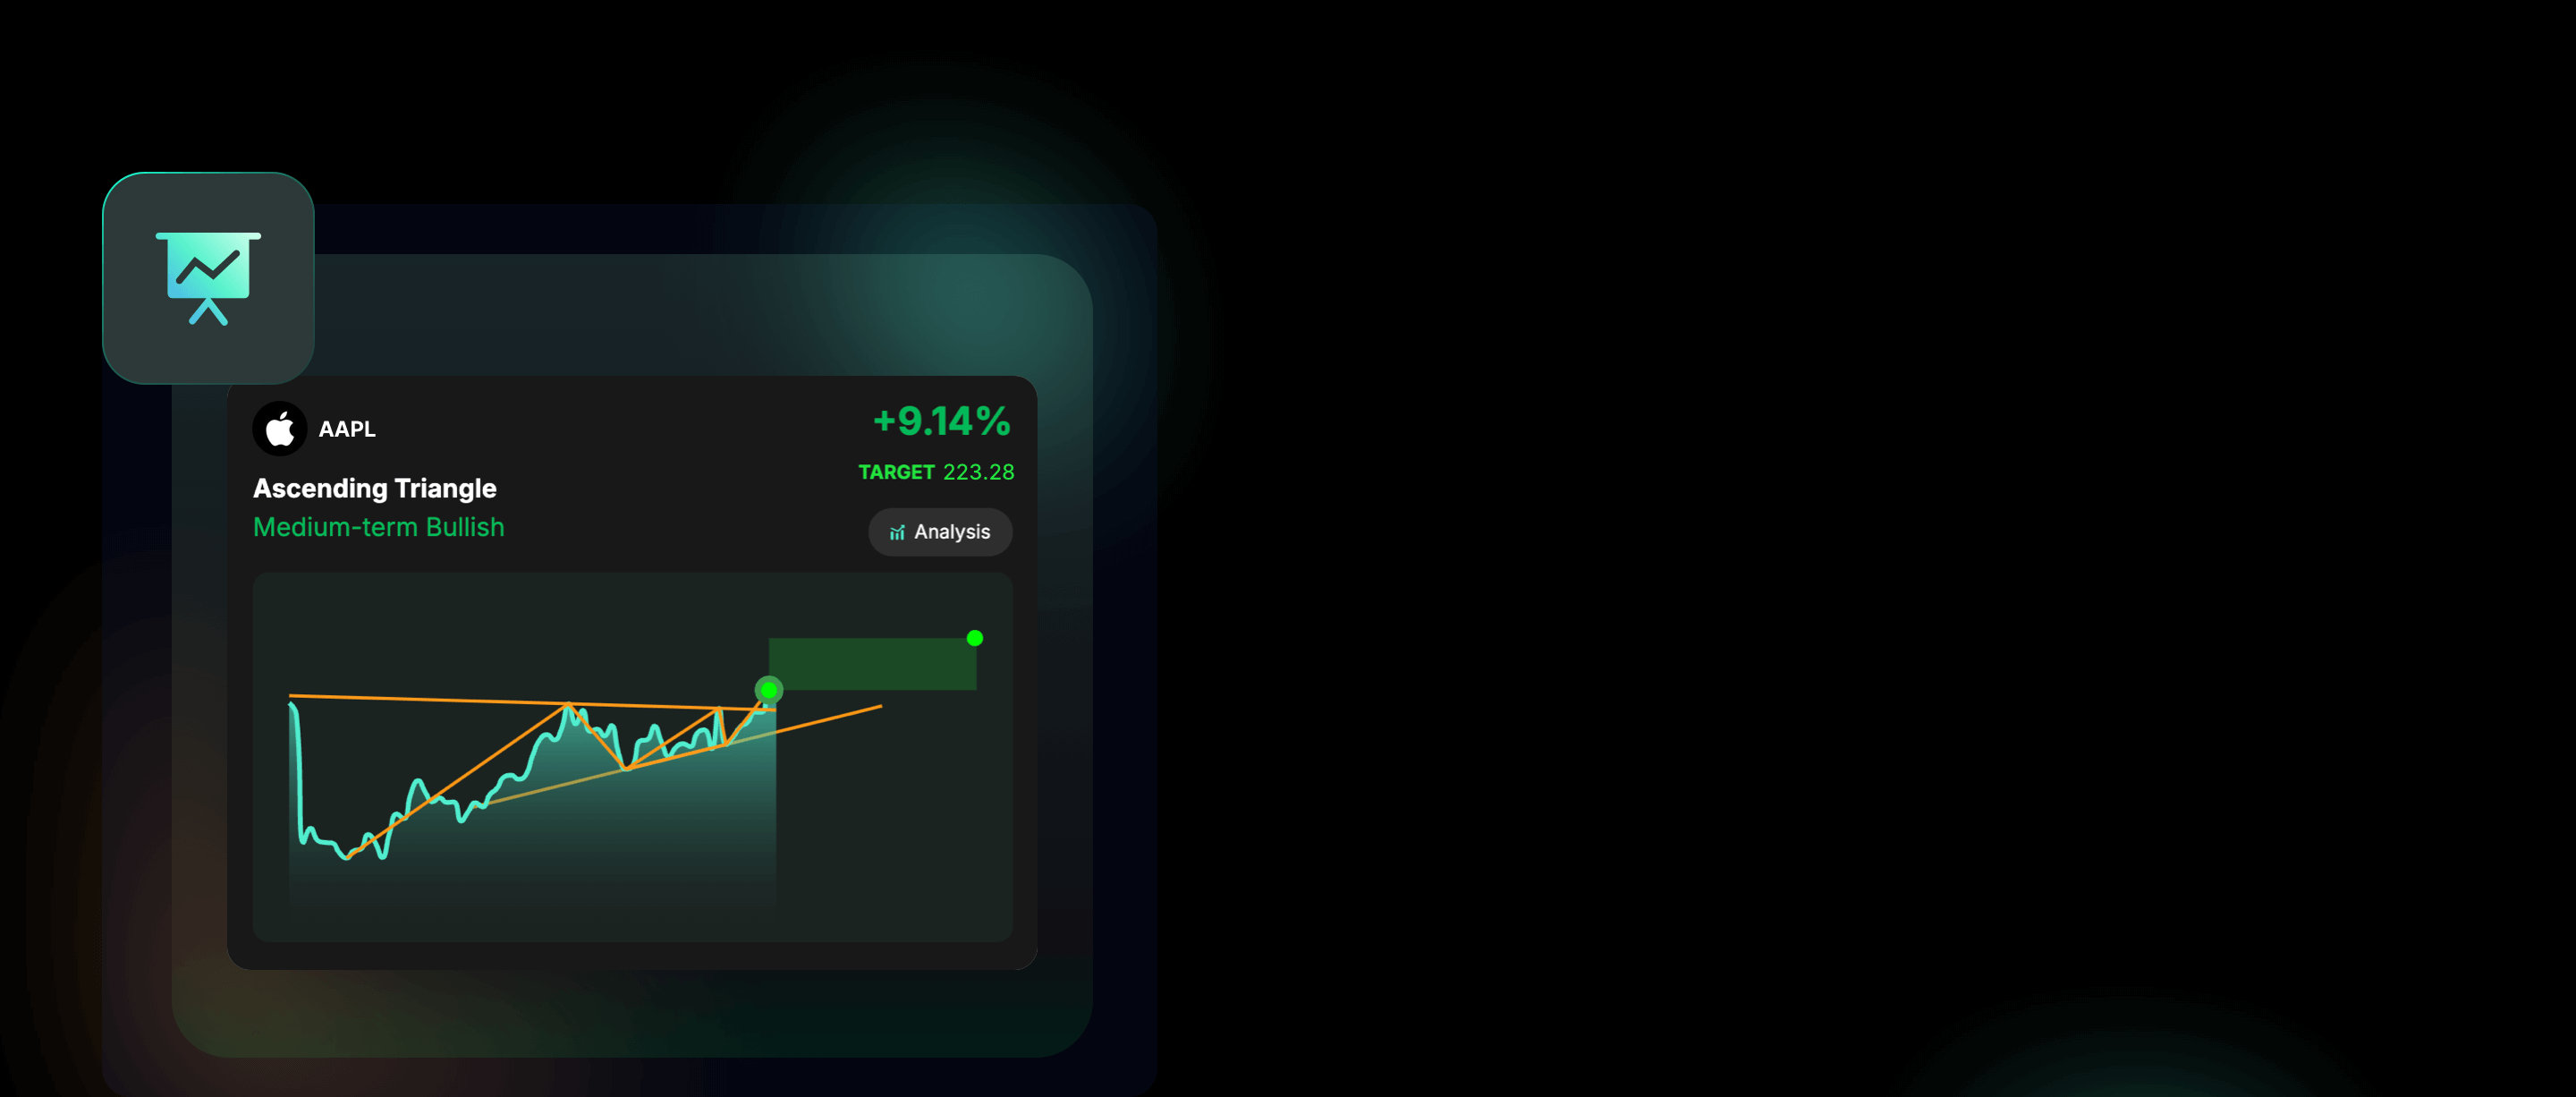
Pattern Signal is a technical analysis tool that identifies valid price patterns in stocks, cryptocurrencies, and ETFs. It highlights key patterns like Head & Shoulders, Inverse Head & Shoulders, and Ascending Triangles, marking the target price and trend direction to provide insights for medium- to short-term trading opportunities.
How can I use Pattern Signal to analyze trading opportunities?
Users can review detected patterns, see the trend classification (e.g., Medium-term Bullish or Bearish), target price, and potential percentage change. By clicking the "Analysis" button, you can dive deeper into the market context and potential trading strategies behind each pattern.
What types of assets does Pattern Signal support?
Pattern Signal supports cryptocurrencies, stocks, and ETFs. You can switch between these asset types using the navigation bar at the top and filter for specific patterns or trend signals.
How do I set alerts in Pattern Signal?
You can click the "Set an Alert" button to customize notifications for specific price patterns. Once the system detects a matching signal, you will receive an alert, ensuring you never miss an important trading opportunity.
Are the insights provided by Pattern Signal updated in real time?
Yes, Pattern Signal analyzes price data from the last five trading days and captures price movements that break significant trendlines. It updates target prices and trend directions promptly to support timely trading decisions.


I've been trading crypto for a while, but identifying good entry points was always a challenge. Chart Pattern Signals has totally changed that for me. The tool highlights key patterns and even gives me a target price, which makes it way easier to make informed decisions. The fact that it's backed by real-time data gives me a lot more confidence in my trades.
Tom Harris
Crypto Trader