RTX Overview
-
$
0.000
0.000(0.000%)
At close0.000(0.000%)Aft-market
ET
Loading chart...

The current price of RTX is 185.6 USD — it has decreased -3.62
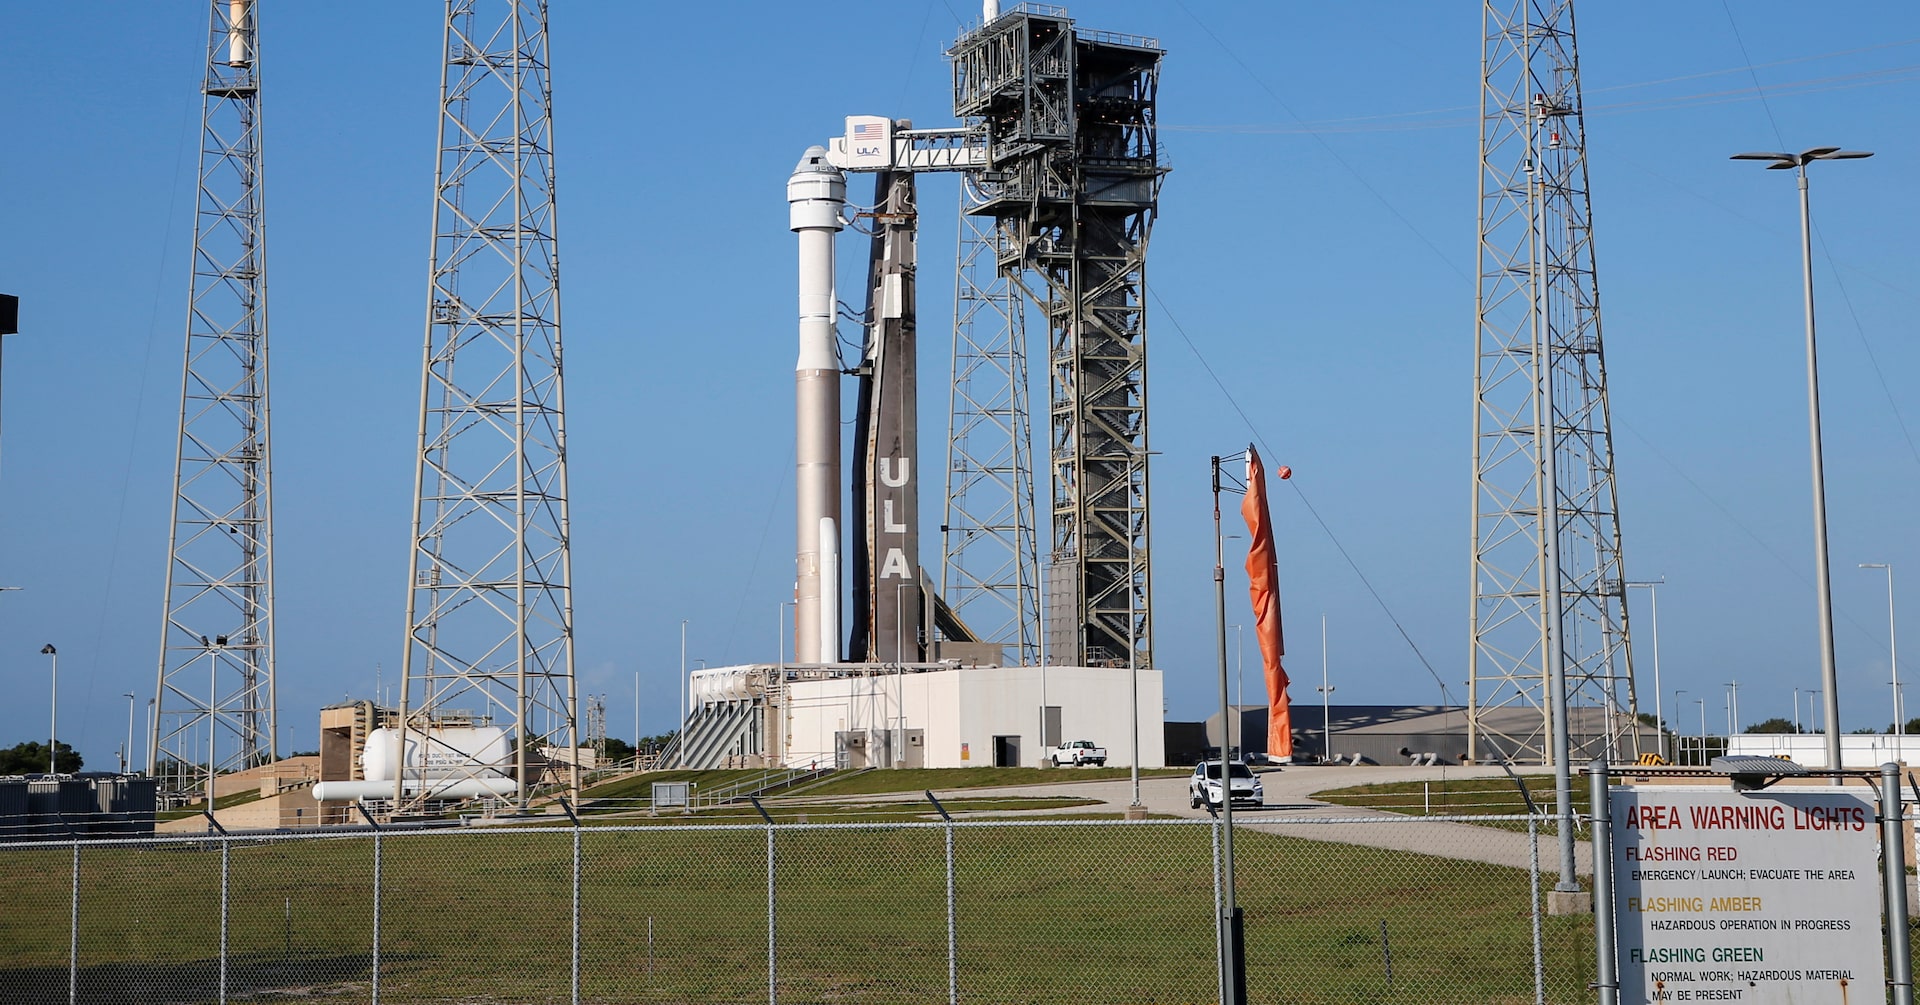
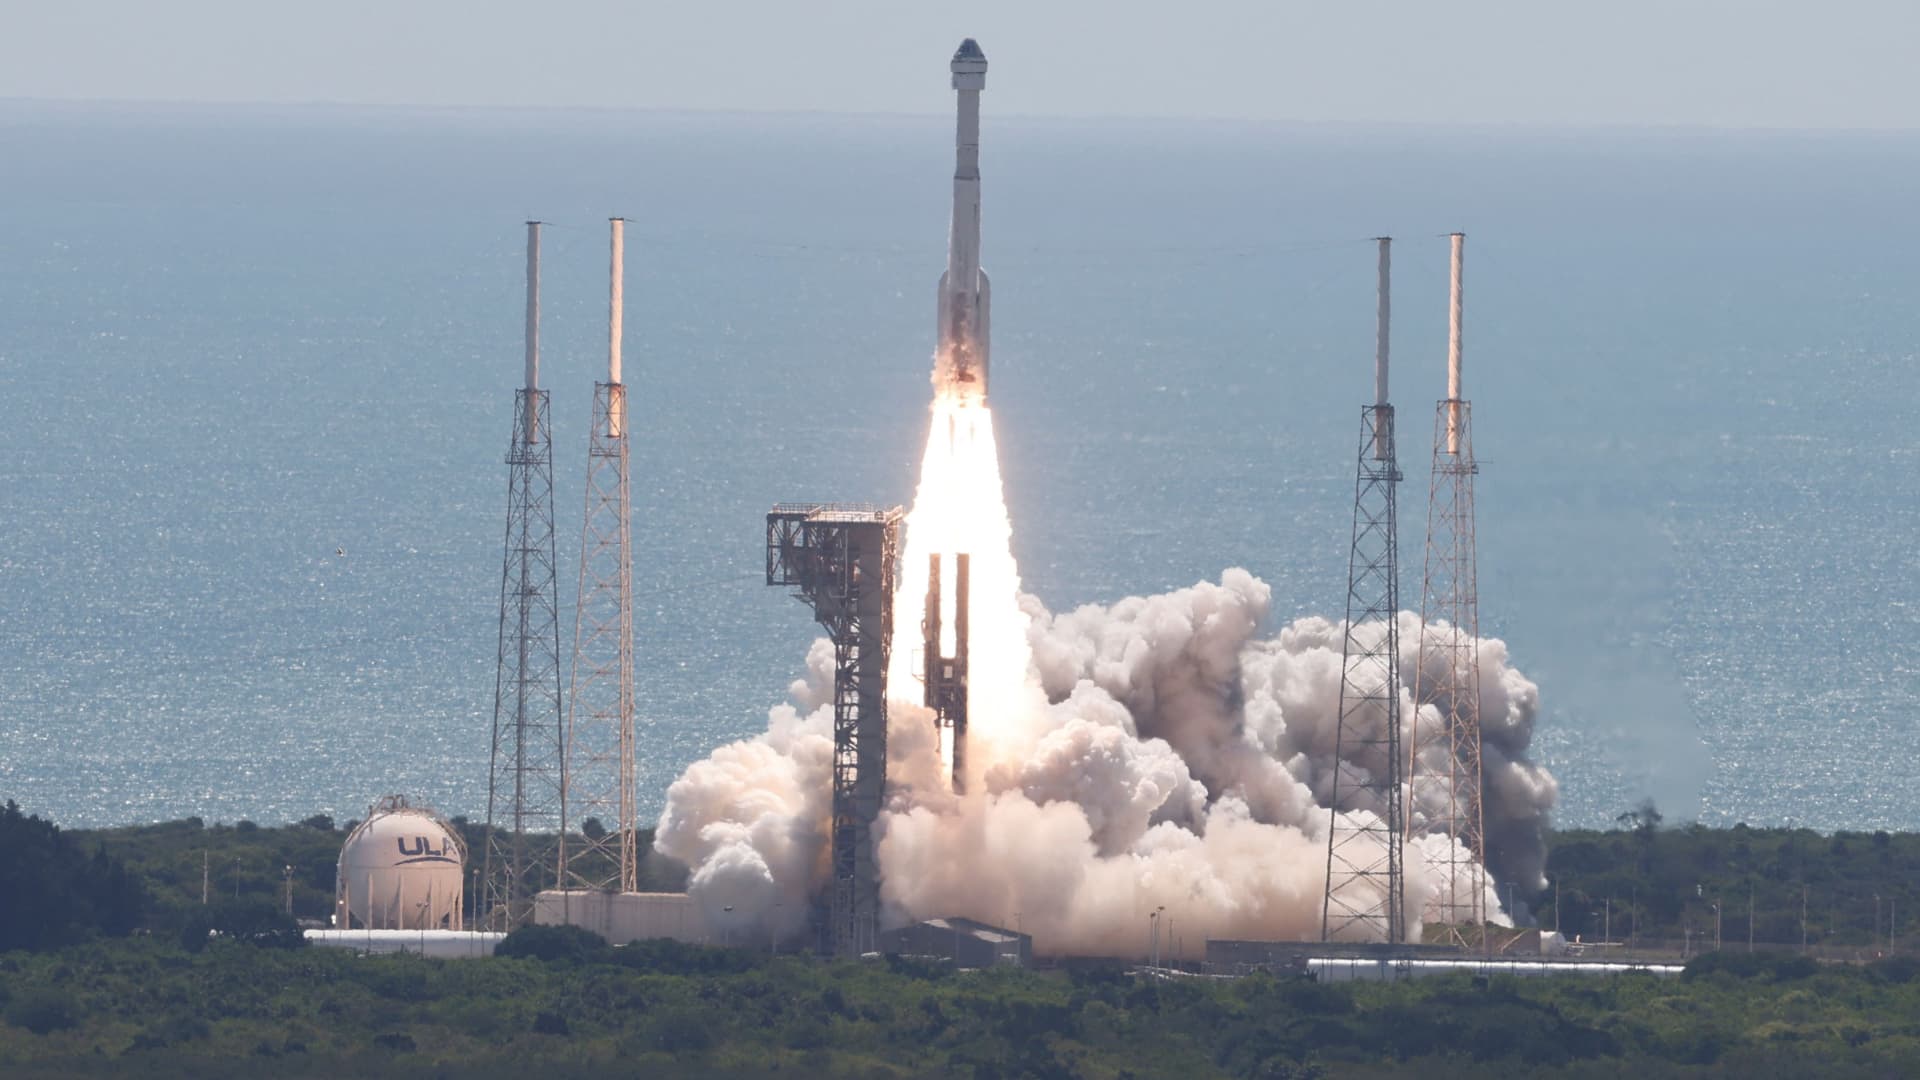
RTX Corporation is an aerospace and defense company, which provides advanced systems and services for commercial, military, and government customers worldwide. The Company operates through three segments: Collins Aerospace, Pratt & Whitney, and Raytheon. Collins Aerospace segment provides technologically advanced aerospace and defense products and aftermarket service solutions for civil and military aircraft manufacturers, commercial airlines, and regional, business and general aviation, as well as for defense and commercial space operations. The Pratt & Whitney segment supplies aircraft engines for commercial, military, business jet, and general aviation customers. The Raytheon segment provides defensive and offensive threat detection, tracking and mitigation capabilities for the United States and foreign government and commercial customers. The Raytheon designs, develops, and provides advanced capabilities in integrated air and missile defense, smart weapons, missiles and others.
Wall Street analysts forecast RTX stock price to rise over the next 12 months. According to Wall Street analysts, the average 1-year price target for RTX is195.77 USD with a low forecast of 168.00 USD and a high forecast of 215.00 USD. However, analyst price targets are subjective and often lag stock prices, so investors should focus on the objective reasons behind analyst rating changes, which better reflect the company's fundamentals.
RTX Corp revenue for the last quarter amounts to 22.08B USD, increased 8.72
RTX Corp. EPS for the last quarter amounts to 1.51 USD, increased 32.46
RTX Corp (RTX) has 180000 emplpoyees as of June 21 2026.
Today RTX has the market capitalization of 249.94B USD.