VALE Overview
-
$
0.000
0.000(0.000%)
At close0.000(0.000%)Aft-market
ET
Loading chart...

The current price of VALE is 14.22 USD — it has increased 1.21
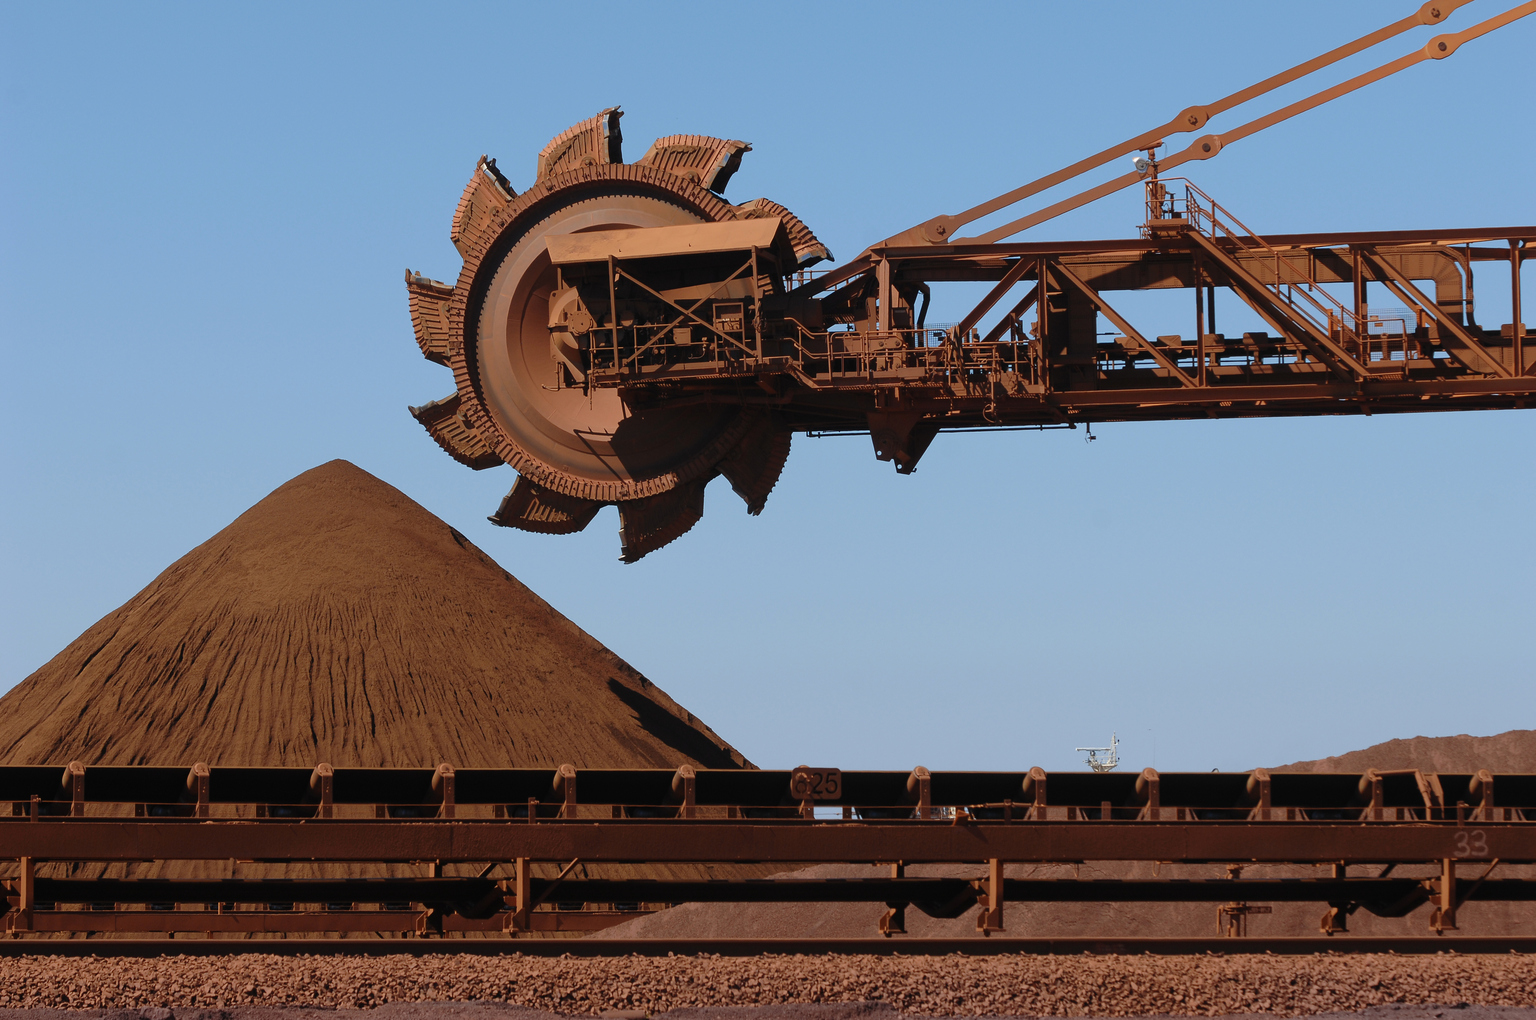
Vale SA, formerly Companhia Vale do Rio Doce, is a Brazil-based metal and mining company which is primarily engaged in producing iron ore and nickel. The Company also produces iron ore pellets, copper, platinum group metals (PGMs), gold, silver and cobalt. Vale is engaged in greenfield mineral exploration in five countries and operates logistics systems in Brazil and other regions in the world, including railroads, maritime terminals and ports, which are integrated with mining operations. In addition, Vale has distribution centers to support the delivery of iron ore worldwide. Vale has numerous subsidiaries, including Vale Logistica Uruguay SA, Vale Holdings BV, Vale Overseas Ltd. The Company’s operations abroad cover approximately 30 countries.
Wall Street analysts forecast VALE stock price to rise over the next 12 months. According to Wall Street analysts, the average 1-year price target for VALE is13.93 USD with a low forecast of 12.00 USD and a high forecast of 15.50 USD. However, analyst price targets are subjective and often lag stock prices, so investors should focus on the objective reasons behind analyst rating changes, which better reflect the company's fundamentals.
Vale SA revenue for the last quarter amounts to 9.24B USD, increased 14.30
Vale SA. EPS for the last quarter amounts to 0.44 USD, increased 33.33
Vale SA (VALE) has 65805 emplpoyees as of July 09 2026.
Today VALE has the market capitalization of 59.92B USD.