XOM Overview
-
$
0.000
0.000(0.000%)
At close0.000(0.000%)Aft-market
ET
Loading chart...

The current price of XOM is 139.975 USD — it has decreased -1.21
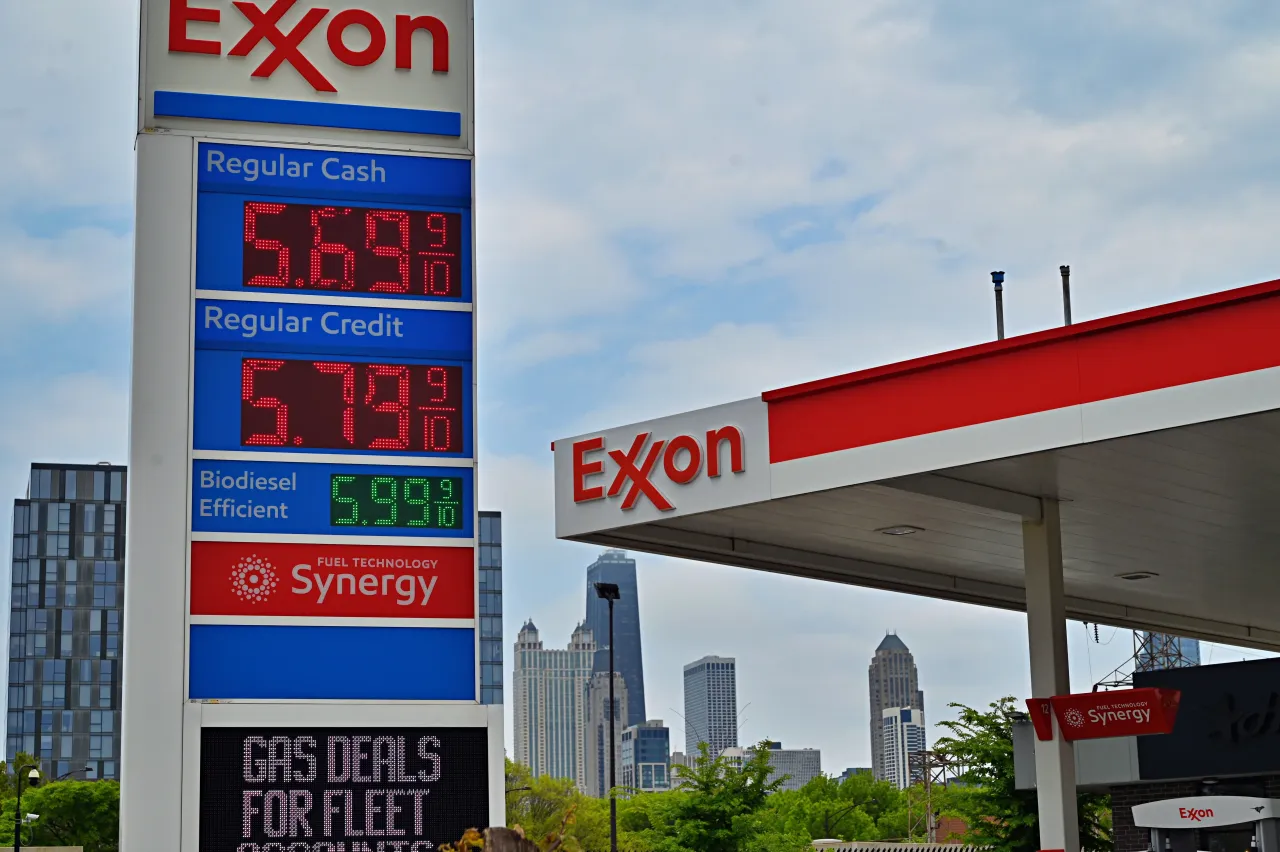
Exxon Mobil Corporation is an integrated fuels, lubricants and chemical company. Its principal business involves exploration for, and production of, crude oil and natural gas; the manufacture, trade, transport and sale of crude oil, natural gas, petroleum products, petrochemicals and a wide variety of specialty products; and pursuit of lower-emission and other new business opportunities, including carbon capture and storage, hydrogen, lower-emission fuels, Proxxima systems, carbon materials, and lithium. Its Upstream segment explores for and produces crude oil and natural gas. The Energy Products, Chemical Products, and Specialty Products segments manufacture and sell petroleum products and petrochemicals. The Energy Products segment includes fuels, aromatics, and catalysts and licensing. The Chemical Products segment consists of olefins, polyolefins, and intermediates. Specialty Products segment includes finished lubricants, basestocks and waxes, synthetics, and elastomers and resins.
Wall Street analysts forecast XOM stock price to rise over the next 12 months. According to Wall Street analysts, the average 1-year price target for XOM is132.17 USD with a low forecast of 114.00 USD and a high forecast of 158.00 USD. However, analyst price targets are subjective and often lag stock prices, so investors should focus on the objective reasons behind analyst rating changes, which better reflect the company's fundamentals.
Exxon Mobil Corp revenue for the last quarter amounts to 83.16B USD, increased 2.59
Exxon Mobil Corp. EPS for the last quarter amounts to 1.00 USD, decreased -43.18
Exxon Mobil Corp (XOM) has 58000 emplpoyees as of July 08 2026.
Today XOM has the market capitalization of 587.30B USD.