Intellectia LogoIntellectia
Product
Resources
Markets
News
Partner Program
Pricing
Log inTry for Free
Intellectia Logo
Log in
Intellectia Logo

Product

Features
Financial AI Agent
Stock Technical Analysis
Stock Monitor
Hedge Fund Tracker
AI Screener
Trading Strategies
AI Stock Picker
Swing Trading
Quant AI
Stock Chart Patterns
Daytrading Center
AI Earnings Prediction
Whales Auto Tracker
Backtesting Playground

Resources

Learn
Blog
Earnings
Tutorial
Help Center
Company
About Us
Contact
Press
Reward Program
Partner Program
Tools
Dividend Calculator
Dividend Yield Calculator
Options Profit Calculator
Compare
TradingView
SeekingAlpha

Markets

Trending Stocks
Hot Crypto
Trending News
All Stocks

News

Trading News
Overview
Top News
Daily Market Brief
Earnings
Latest
Newswire
Stock News
Crypto News
Monitor News
Partner ProgramPricing
Start for Free
  1. Home
  2. >
  3. Stock
  4. >
  5. GFI
stocks logo

GFI

-
collectAdd to Watchlistadvanced chartAdvanced Chart
$
0.000
0(0.000%)1D
collectadvanced chart
    Overview
    Forecast
    Valuation
    Earnings
High
--
Open
--
VWAP
--
Vol
--
Mkt Cap
--
Low
--
Amount
--
EV/EBITDA(TTM)
--
Total Shares
--
EV
--
EV/OCF(TTM)
--
P/S(TTM)
--
AI Stock Picker
AI Stock Picker
Wall Street analysts forecast GFI stock price to rise over the next 12 months. According to Wall Street analysts, the average 1-year price target for GFI is 48.29 USD with a low forecast of 39.00 USD and a high forecast of 62.00 USD. However, analyst price targets are subjective and often lag stock prices, so investors should focus on the objective reasons behind analyst rating changes, which better reflect the company's fundamentals.
8 Analyst Rating
Wall Street analysts forecast GFI stock price to rise over the next 12 months. According to Wall Street analysts, the average 1-year price target for GFI is 48.29 USD with a low forecast of 39.00 USD and a high forecast of 62.00 USD. However, analyst price targets are subjective and often lag stock prices, so investors should focus on the objective reasons behind analyst rating changes, which better reflect the company's fundamentals.
4 Buy
4 Hold
0 Sell
Moderate Buy
Current: 41.620
sliders
Low
39.00
Averages
48.29
High
62.00
Current: 41.620
sliders
Low
39.00
Averages
48.29
High
62.00
JPMorgan
Patrick Jones
maintain
$62 -> $64
2025-12-03
New
Reason
JPMorgan
Patrick Jones
Price Target
$62 -> $64
2025-12-03
New
maintain
Reason
JPMorgan analyst Patrick Jones raised the firm's price target on Gold Fields to $64 from $62 and keeps an Overweight rating on the shares.
Citi
Ephrem Ravi
Buy
maintain
$50 -> $57
2025-11-26
Reason
Citi
Ephrem Ravi
Price Target
$50 -> $57
2025-11-26
maintain
Buy
Reason
Citi analyst Ephrem Ravi raised the firm's price target on Gold Fields to $57 from $50 and keeps a Buy rating on the shares. The firm cites the company's Q3 report and higher gold price estimates for the target boost.
RBC Capital
Josh Wolfson
Outperform
downgrade
$48 -> $45
2025-11-24
Reason
RBC Capital
Josh Wolfson
Price Target
$48 -> $45
2025-11-24
downgrade
Outperform
Reason
RBC Capital analyst Josh Wolfson lowered the firm's price target on Gold Fields to $45 from $48 and keeps an Outperform rating on the shares. The firm is citing the company's inaugural 5-year guidance that reflects higher reinvestment to deliver steady growth, also noting Gold Fields' introduction of a competitive capital returns program, the analyst tells investors in a research note.
BMO Capital
Market Perform
maintain
$32 -> $44
2025-11-17
Reason
BMO Capital
Price Target
$32 -> $44
2025-11-17
maintain
Market Perform
Reason
BMO Capital raised the firm's price target on Gold Fields to $44 from $32 and keeps a Market Perform rating on the shares. Gold Fields hosted a Capital Markets Day, which highlighted medium- to long-term growth plans and increased portfolio reinvestment, but also improved capital returns, the analyst tells investors in a research note. The current gold price environment provides capacity for a sector-wide uplift in reinvestment capital, the firm says.
Citi
Ephrem Ravi
initiated
$50
2025-10-28
Reason
Citi
Ephrem Ravi
Price Target
$50
2025-10-28
initiated
Reason
Citi analyst Ephrem Ravi initiated coverage of Gold Fields with a Buy rating and $50 price target. The firm expects the stock's multiple to expand further given the company's increasing gold production and higher gold prices. Citi remains constructive on gold prices in the near term.
Scotiabank
Sector Perform
upgrade
$30 -> $47
2025-10-23
Reason
Scotiabank
Price Target
$30 -> $47
2025-10-23
upgrade
Sector Perform
Reason
Scotiabank raised the firm's price target on Gold Fields to $47 from $30 and keeps a Sector Perform rating on the shares. The firm is updating its price targets on Gold & Precious Minerals stocks under its coverage, the analyst tells investors. Precious metals prices continue to rally due to global trade and geopolitical uncertainty, the firm adds. Additionally, the firm notes capital returns and corporate M&A momentum is poised to continue.
See All Ratings

Valuation Metrics

The current forward P/E ratio for Gold Fields Ltd (GFI.N) is 12.84, compared to its 5-year average forward P/E of 9.84. For a more detailed relative valuation and DCF analysis to assess Gold Fields Ltd 's fair value, click here.
  • Forward PE
  • Forward EV/EBITDA
  • Forward PS

Forward PE

The forward P/E ratio is a valuation metric that divides a company's current stock price by its estimated future earnings per share over the next 12 months.
StronglyUndervaluedUndervaluedFairOvervaluedStronglyOvervalueddotted line Image
Overvalued
5Y Average PE
9.84
Current PE
12.84
Overvalued PE
12.40
Undervalued PE
7.28

Forward EV/EBITDA

The forward EV/EBITDA ratio is a valuation metric that divides a company's enterprise value (EV) by its estimated future earnings before interest, taxes, depreciation, and amortization (EBITDA) over the next 12 months.
StronglyUndervaluedUndervaluedFairOvervaluedStronglyOvervalueddotted line Image
Overvalued
5Y Average EV/EBITDA
4.73
Current EV/EBITDA
5.77
Overvalued EV/EBITDA
5.47
Undervalued EV/EBITDA
4.00

Forward PS

The forward P/S ratio is a valuation metric that divides a company's current stock price by its estimated future sales (or revenue) per share over the next 12 months.
StronglyUndervaluedUndervaluedFairOvervaluedStronglyOvervalueddotted line Image
Strongly Overvalued
5Y Average PS
2.39
Current PS
3.82
Overvalued PS
2.91
Undervalued PS
1.88
Financial AI Agent
Financial AI Agent

Financials

Annual
Quarterly

Trading Trends

  • Insider
  • Hedge Fund
  • Congress Trading
Insider
Insiders are Neutral. There are no significant trading trends over the last month.
Sold
Bought
Hedge Fund
Hedge Funds are Neutral. There are no significant trading trends over the last quarter.
Sold
Bought
Congress Trading
Congress are Neutral. There are no significant trading trends over the last month.
Sold
Bought
Insider
Insiders are Neutral. There are no significant trading trends over the last month.
Sold
Bought
Intellectia AI SwingMax

GFI News & Events

Events Timeline

(ET)
2025-09-26
06:21:08
Gold Fields to divest stake in Northern Star for A$1.1 billion, according to Bloomberg.
select
link
2025-05-06 (ET)
2025-05-06
05:36:05
AngloGold Ashanti, Gold Fields pause discussions about proposed joint venture
select
2025-05-05 (ET)
2025-05-05
10:00:08
Gold Fields rises 6.5%
select
Sign Up For More Events

News

[object Object]
Preview
3.0
12-04NASDAQ.COM
Searching for a Leading Momentum Stock? Here's Why Gold Fields (GFI) is an Excellent Option
  • Momentum Investing Overview: Momentum investing involves buying stocks that are trending upwards, with the expectation that they will continue to rise. The Zacks Momentum Style Score helps investors identify stocks with strong momentum, like Gold Fields (GFI), which currently has a score of A and a Zacks Rank of #1 (Strong Buy).

  • Gold Fields Performance: Gold Fields has shown significant price increases, with shares up 15.81% over the past quarter and 185.38% over the last year, outperforming the S&P 500. The stock's recent performance, including an 11.55% rise in the past week, indicates strong momentum compared to its industry.

  • Earnings Estimate Revisions: GFI has seen positive trends in earnings estimate revisions, with three estimates moving higher for the current year and next fiscal year, boosting its consensus estimate from $2.79 to $3.18 over the past 60 days.

  • Investment Recommendation: Given its strong performance metrics and positive earnings revisions, Gold Fields is recommended as a solid momentum pick for investors looking for potential short-term gains.

[object Object]
Preview
2.0
11-28Benzinga
Tilray Brands, SuperX AI Technology, and Other Major Stocks Decline in Friday's Pre-Market Trading
  • U.S. Stock Futures: U.S. stock futures rose this morning, with Dow futures increasing by approximately 50 points on Friday.

  • Tilray Brands Inc: Shares of Tilray Brands Inc fell 15% in pre-market trading after announcing a one-for-10 reverse stock split, set to take effect on December 1.

  • Other Stocks Declining: Several other stocks also experienced declines in pre-market trading, including Inventiva ADR (-7.4%), Anglogold Ashanti PLC (-5.5%), and Lexicon Pharmaceuticals Inc (-5%).

  • Market Movements: SuperX AI Technology Ltd saw a significant drop of 3.9% after a previous surge, while Gold Fields Ltd and Abacus Global Management Inc also reported declines following recent gains.

[object Object]
Preview
3.0
11-28NASDAQ.COM
GFI or CDE: Which Gold Mining Stock is the Superior Investment at This Time?
  • Gold Fields Limited Overview: Gold Fields is a diversified gold producer with significant operations in Africa, Australia, and the Americas, focusing on consistent production and cost management. The company reported a 22% year-over-year increase in gold output, reaching approximately 621,000 ounces in Q3 2025, driven by the Salares Norte mine.

  • Coeur Mining Overview: Coeur Mining operates primarily in North America, with a focus on silver and gold production. In Q3 2025, the company achieved a 17% year-over-year increase in gold production, totaling 111,364 ounces, and is pursuing an acquisition of New Gold Inc. to enhance its market position.

  • Financial Performance Comparison: Gold Fields has a stronger financial position with a significant reduction in net debt and a higher dividend yield, while Coeur Mining has shown robust cash flow growth and is investing heavily in exploration and mine-life extensions.

  • Investment Outlook: Gold Fields is viewed as a more attractive investment option due to its larger production base and competitive cost structure, earning a Zacks Rank of #1 (Strong Buy), while Coeur Mining holds a Zacks Rank of #3 (Hold), indicating a preference for GFI among investors seeking growth in the gold sector.

Sign Up For More News

People Also Watch

FAQ

arrow icon

What is Gold Fields Ltd (GFI) stock price today?

The current price of GFI is 41.62 USD — it has increased 1.91 % in the last trading day.

arrow icon

What is Gold Fields Ltd (GFI)'s business?

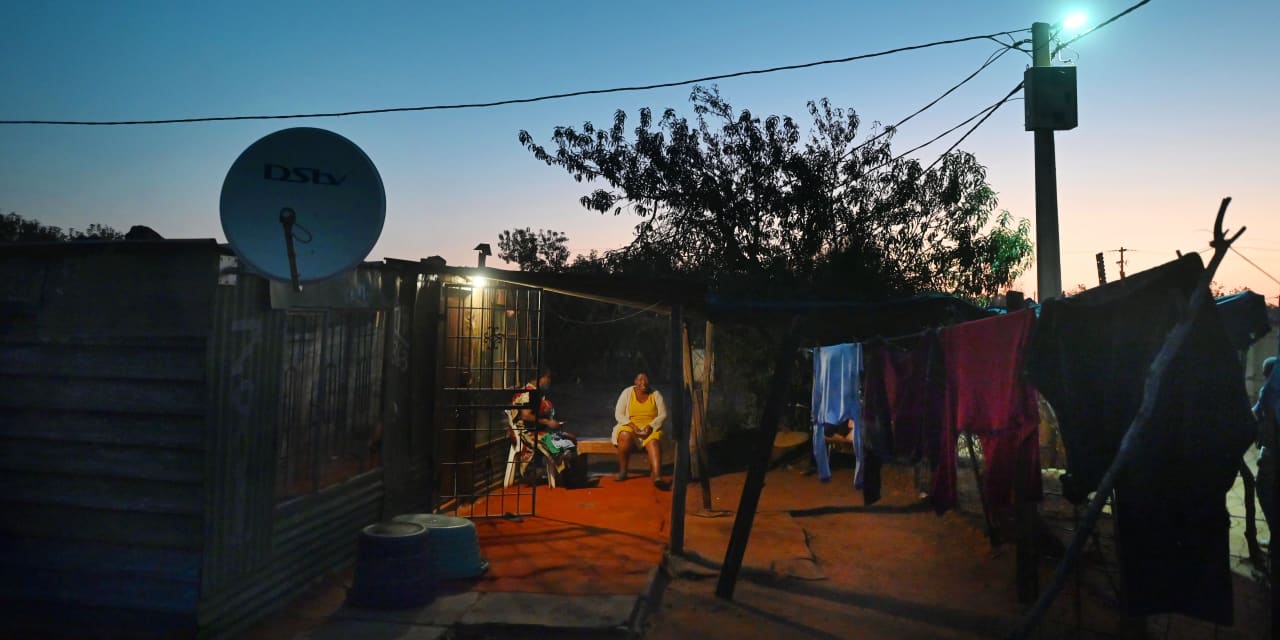
Gold Fields Limited is a globally diversified gold producer with approximately nine operating mines in Australia, South Africa, Ghana, Chile and Peru and one project in Canada. The Company is involved in underground and surface gold and surface copper mining and silver and related activities, including exploration, extraction, processing and smelting. It has a total attributable annual gold-equivalent production of over 2.30 million ounces (Moz), gold mineral reserves of 44.6 Moz and gold mineral resources of 30.3 Moz (excluding mineral resources). In Peru, the Company also produces copper. Its economic interest in the South Deep mine in South Africa is 96.43%. It also owns 100% of the St Ives, Agnew, Granny Smith mines and around 50% of the Gruyere gold mine in Australia, and 90.0% of the Tarkwa and Damang mines in Ghana and 45% of the Asanko mine in Ghana. It owns 99.5% of the Cerro Corona mine in Peru. It also has 100% ownership of the Windfall Project in Canada’s Quebec province.

arrow icon

What is the price predicton of GFI Stock?

Wall Street analysts forecast GFI stock price to rise over the next 12 months. According to Wall Street analysts, the average 1-year price target for GFI is 48.29 USD with a low forecast of 39.00 USD and a high forecast of 62.00 USD. However, analyst price targets are subjective and often lag stock prices, so investors should focus on the objective reasons behind analyst rating changes, which better reflect the company's fundamentals.

arrow icon

What is Gold Fields Ltd (GFI)'s revenue for the last quarter?

Gold Fields Ltd revenue for the last quarter amounts to NaN USD, decreased % YoY.

arrow icon

What is Gold Fields Ltd (GFI)'s earnings per share (EPS) for the last quarter?

Gold Fields Ltd. EPS for the last quarter amounts to USD, decreased % YoY.

arrow icon

What changes have occurred in the market's expectations for Gold Fields Ltd (GFI)'s fundamentals?

The market is revising No Change the revenue expectations for GFI for , with the revenue forecasts being adjusted by % over the past three months. During the same period, the stock price has changed by 24.61%.
arrow icon

How many employees does Gold Fields Ltd (GFI). have?

Gold Fields Ltd (GFI) has 6560 emplpoyees as of December 05 2025.

arrow icon

What is Gold Fields Ltd (GFI) market cap?

Today GFI has the market capitalization of 37.25B USD.

Intellectia LogoIntellectiaIntellectia LogoIntellectia

Redefine Your Investment Decisions

TwitterTwitterYoutubeYoutubeQuoraQuoraDiscordDiscordLinkedinLinkedinTelegramTelegram
AppStoreGooglePlay

Copyright © 2025 Intellectia.AI. All Rights Reserved.

pci certified logo
Company
HomeContactAbout UsNews Release
Compare
TradingViewSeeking Alpha
Features
Financial AI AgentStock Technical AnalysisStock MonitorHedge Fund TrackerAI ScreenerDaytrading Center
Strategies
AI Stock PickerSwing TradingStock Chart PatternsEarnings TradingDaytrading CenterAI Earnings PredictionQuant AIWhales Auto TrackerBacktesting Playground
Free Tools
Dividend CalculatorDividend Yield CalculatorOptions Profit Calculator
Resource
BlogTutorialEarningsTrending StocksCrypto MarketPartner ProgramTerms of UsePrivacy PolicySecuritySitemap
Start for Free