Loading...

Intellectia LogoIntellectia
AI Trading Bot
Features
Markets
News
Resources
Pricing
Get Started
  1. Home
  2. Stock
  3. TGT
TGT logo

TGT Overview

-
$
0.000
0.000(0.000%)
At close
0.000(0.000%)Aft-market
ET
$
0.000
0.000(0.000%)
At close
0.000(0.000%)Aft-market
ET
OverviewStock Price PredictionTechnicalValuationFinancialsEarningsShould I BuyNews & Events
an image of Intellectia Logoan image of Intellectia

Most Trusted AI Platform for Winning Trades

TwitterYoutubeQuoraDiscordLinkedinTelegram

Copyright © 2026 Intellectia.AI. All Rights Reserved.

Company

  • Home
  • Contact
  • About Us
  • Press
  • Privacy
  • Terms of Service
  • Service Terms of Use

Resources

  • Blog
  • Tutorial
  • Help Center
  • Affiliate Program

Markets

  • Market Analysis
  • Crypto
  • Featured Screeners
  • AI Earnings Calendar
  • Market Movers
  • Stock Monitor
  • Economic Calendar
  • All US Stocks
  • All Cryptos

Tools

  • Dividend Calculator
  • Dividend Yield Calculator
  • Options Profit Calculator

Features

  • QuantAI Alpha Pick
  • SwingMax Portfolio
  • Swing Trading
  • AI Stock Picker
  • Whales Auto Tracker
  • Daytrading Center
  • Patterns Detection
  • AI Screener
  • Financial AI Agent
  • Backtesting Playground
  • AI Earnings Prediction
  • Stock Monitor
  • Technical Analysis

News

  • Overview
  • Top News
  • Daily Market Brief
  • Earnings Analysis
  • Newswire
  • Stock News
  • Crypto News
  • Institution News
  • Congress News
  • Monitor News

Compare

  • TradingView
  • SeekingAlpha
Intellectia

Loading chart...

High
121.300
Open
120.120
VWAP
119.67
Vol
2.10M
Mkt Cap
54.27B
Low
118.530
Amount
251.61M
EV/EBITDA(TTM)
7.17
Total Shares
452.86M
EV
65.24B
EV/OCF(TTM)
9.94
P/S(TTM)
0.52
Target Corporation is a general merchandise retailer selling products to its guests through its stores and digital channels. The Company offers customers, referred to as guests, everyday essentials and fashionable, differentiated merchandise at discounted prices. The majority of its stores offer a wide assortment of general merchandise and food. Its merchandise categories include apparel and accessories, beauty and household essentials, food and beverage, hardlines, and home furnishings and decor. Most of its stores are larger than 170,000 square feet, offer a variety of general merchandise and a full line of food items comparable to traditional supermarkets. Its digital channels include a wide merchandise and food assortment, including many items found in its stores, along with a complementary assortment sold by the Company and third parties. Its brands include A New Day, Ava & Viv, Cloud Island, Favorite Day, and others. It serves guests at nearly 2,000 stores and at Target.com.
Show More

Events Timeline

(ET)
2026-03-17
06:30:00
Major Tech and Retail Giants Sign Accord Against Online Scams
select
link
2026-03-05 (ET)
2026-03-05
06:40:00
Target Plans to Open Over 30 New Stores in 2026
select
2026-03-04 (ET)
2026-03-04
16:20:00
U.S. Service Sector Expansion Boosts Stocks
select

News

Marketbeat
2.0
11:18 AMMarketbeat
Target Soars in 2026—Wall Street Might Be Poised to Take a Break
  • Target's Stock Performance: Target's stock has seen a significant rise of over 20% in 2026 as investor confidence grows in the retailer's turnaround plan under new CEO Michael Fiddelke, despite previous struggles following a sharp decline after the pandemic peak.

  • Challenges and Competition: The company has faced challenges from competitors like Walmart, which has gained market share, while Target's stock fell more than 50% during a rough period, highlighting the volatility and pressures from inflation and changing consumer behavior.

  • Future Growth Expectations: Target's recent earnings report showed mixed results, with earnings per share exceeding expectations but revenue declining slightly. The company anticipates modest sales growth of about 2% year-over-year and plans to invest over $5 billion in improvements across its business.

  • Analyst Sentiment: Following the earnings report, analysts have raised their price targets for Target's stock, indicating a cautious optimism about the company's potential for recovery, although many remain cautious and are waiting for clearer evidence of a successful turnaround strategy.

Fool
4.0
03-29Fool
2026 Economic Outlook and Uber Developments
  • GDP Growth Slowdown: The GDP growth rate for Q1 2026 is only 0.7%, significantly lower than the previous estimate of 1.4%, indicating a sluggish economic recovery that may dampen investor confidence and negatively impact stock market performance.
  • Rising Inflation Pressure: With inflation exceeding 3% in January, combined with slowing GDP growth, concerns about stagflation may arise, leading to reduced consumer spending and threatening corporate profitability.
  • Surge in Oil Prices: West Texas Intermediate crude oil prices have surged from $57 on January 2 to $93, even exceeding $100 at times, increasing consumer energy expenditure pressure and potentially suppressing spending in other areas.
  • Uber's Autonomous Driving Partnerships: Uber has recently formed partnerships with several companies, including Waymo and Lucid, indicating its proactive positioning in the autonomous driving sector, which may lay the groundwork for future market share growth.
NASDAQ.COM
4.0
03-29NASDAQ.COM
2026 Economic Outlook and Oil Price Fluctuations
  • GDP Growth Slowdown: The GDP growth rate for Q1 2026 is only 0.7%, significantly lower than the previous estimate of 1.4%, indicating economic stagnation that may heighten investor concerns about future economic prospects.
  • High Inflation Pressure: With inflation exceeding 3% in January, combined with low growth, market fears of stagflation are rising, which could negatively impact consumer spending and business investment decisions, further dragging down economic recovery.
  • Surging Oil Prices Impact: As of the recording date, West Texas Intermediate crude oil prices have reached $93 per barrel, a significant increase from $57 on January 2, which may force consumers to cut back on other expenditures due to rising energy costs, affecting overall economic activity.
  • Geopolitical Risks: The rise in oil prices is primarily driven by geopolitical conflicts rather than demand growth, particularly due to uncertainties surrounding Iran, which could lead to a more pessimistic economic outlook, necessitating close monitoring of related developments.
CNBC
4.5
03-29CNBC
Analysis of Retail Sector Impact from Rising Oil Prices
  • Impact of Rising Oil Prices: Brent crude futures have surged above $110 per barrel due to the ongoing Middle East conflict, with diesel prices exceeding $5 per gallon for the first time since 2022, potentially imposing secondary effects on the U.S. retail sector and increasing household budget pressures.
  • Advantage of Higher-Income Customers: Deutsche Bank analysts noted that retailers like Ulta Beauty and Costco, which cater to higher-income demographics, have historically shown a positive correlation between sales and rising oil prices, indicating better sales performance in such environments.
  • Pressure on Lower-Income Customers: Conversely, retailers like BJ's Wholesale Club and Burlington Stores, which primarily serve lower-income customers, exhibit negative sales correlations with rising gas prices, highlighting a trend where lower-income consumers reduce spending as fuel costs increase.
  • Inventory Management Strategy: Despite the risks associated with rising input costs, many global brands, including Amer Sports and Birkenstock, maintain over 200 days of finished goods inventory, which helps mitigate near-term margin pressures and ensures market stability amid supply chain disruptions.
NASDAQ.COM
8.5
03-28NASDAQ.COM
Investment Opportunities in Target, Chevron, and PepsiCo
  • Target's Transformation Plan: Newly appointed CEO Michael Fiddelke took over on February 1, outlining a $5 billion investment plan over the next few years to upgrade stores, hire more staff, and enhance AI capabilities, with analysts forecasting a 3% net sales growth in fiscal 2026 despite a 2% sales decline in fiscal 2025.
  • Chevron's Robust Dividends: Chevron has increased its dividend for 39 consecutive years, paying $7.12 per share in 2025, yielding 3.3%; although the dividend cost was $12.8 billion, its $16.6 billion in free cash flow ensures the potential for future dividend growth.
  • PepsiCo's Brand Revival: PepsiCo reported $93 billion in revenue, growing 2%, with an annual dividend of $5.69 per share yielding 3.8%; the company is cutting costs using AI and closing less productive plants to enhance brand competitiveness.
  • Market Environment Impact: Amid heightened geopolitical tensions, consumers are leaning towards essentials, prompting investors to rotate into consumer staples stocks for stable dividend returns, positioning Target, Chevron, and PepsiCo as strong growth and income opportunities in this climate.
Fool
8.5
03-28Fool
Investment Opportunities in Consumer Staples Stocks Amid Geopolitical Tensions
  • Target's Challenges and Opportunities: Despite a 2% sales decline in fiscal 2025, Target (TGT) is investing $5 billion under new CEO Michael Fiddelke to upgrade stores and enhance AI capabilities, with analysts forecasting a 3% net sales growth in fiscal 2026, indicating a strategic recovery effort amidst adversity.
  • Stable Dividend Returns: Target has increased its dividend for 54 consecutive years, currently at $4.56 per share with a yield of nearly 4%, significantly above the S&P 500's 1.2%, providing investors with reliable cash flow despite ongoing challenges.
  • Chevron's Growth Potential: As a leading gasoline retailer, Chevron (CVX) remains well-positioned with 70% of U.S. energy consumption from its products, and its dividend, which has risen for 39 years, pays $7.12 per share with a yield of 3.3%, reflecting strong long-term demand despite geopolitical tensions.
  • PepsiCo's Brand Revitalization: Facing health-conscious consumer trends, PepsiCo (PEP) is revitalizing its brands and cutting costs, maintaining a 54-year dividend growth at $5.69 per share with a yield of 3.8%, indicating its potential for recovery and growth in a challenging market.
Wall Street analysts forecast TGT stock price to rise
26 Analyst Rating
Wall Street analysts forecast TGT stock price to rise
8 Buy
14 Hold
4 Sell
Hold
Current: 0.000
sliders
Low
80.00
Averages
98.83
High
126.00
Current: 0.000
sliders
Low
80.00
Averages
98.83
High
126.00
DA Davidson
Buy
upgrade
$120 -> $140
AI Analysis
2026-03-09
Reason
DA Davidson
Price Target
$120 -> $140
AI Analysis
2026-03-09
upgrade
Buy
Reason
DA Davidson raised the firm's price target on Target to $140 from $120 and keeps a Buy rating on the shares. The firm raised its FY26 and FY27 EPS estimates based on the company's Q4 results and 2026 guidance.
Argus
Christopher Graja
maintain
$125 -> $145
2026-03-06
Reason
Argus
Christopher Graja
Price Target
$125 -> $145
2026-03-06
maintain
Reason
Argus analyst Christopher Graja raised the firm's price target on Target to $145 from $125 and keeps a Buy rating on the shares.
Unlock Full Analyst Thesis, Get the complete breakdown of rating reason for TGT
Unlock Now

Valuation Metrics

The current forward P/E ratio for Target Corp (TGT.N) is 12.60, compared to its 5-year average forward P/E of 17.35. For a more detailed relative valuation and DCF analysis to assess Target Corp's fair value, Click here.

Forward PE

The forward P/E ratio is a valuation metric that divides a company's current stock price by its estimated future earnings per share over the next 12 months.
StronglyUndervaluedUndervaluedFairOvervaluedStronglyOvervalueddotted line Image
5Y Average PE
17.35
Current PE
12.60
Overvalued PE
23.32
Undervalued PE
11.39

Forward EV/EBITDA

The forward EV/EBITDA ratio is a valuation metric that divides a company's enterprise value (EV) by its estimated future earnings before interest, taxes, depreciation, and amortization (EBITDA) over the next 12 months.
StronglyUndervaluedUndervaluedFairOvervaluedStronglyOvervalueddotted line Image
5Y Average EV/EBITDA
10.25
Current EV/EBITDA
7.66
Overvalued EV/EBITDA
12.67
Undervalued EV/EBITDA
7.84

Forward PS

The forward P/S ratio is a valuation metric that divides a company's current stock price by its estimated future sales (or revenue) per share over the next 12 months.
StronglyUndervaluedUndervaluedFairOvervaluedStronglyOvervalueddotted line Image
5Y Average PS
0.70
Current PS
0.51
Overvalued PS
0.93
Undervalued PS
0.46

Financials

AI Analysis
Annual
Quarterly

Related Community Screener

best screener for 1 week naked calls
Intellectia · 15 candidates
Market Cap: >= 10.00BMarket Cap Category: largeList Exchange: XNYS, XNAS, XASEIs Optionable: TrueOption Iv Rank: >= 50One Week Rise Prob: <= 45Monthly Average Dollar Volume: >= 1,000,000
Ticker
Name
Market Cap$
top bottom
SE logo
SE
Sea Ltd
64.20B
OKTA logo
OKTA
Okta Inc
12.85B
WPM logo
WPM
Wheaton Precious Metals Corp
74.30B
B logo
B
Barrick Mining Corp
85.01B
BURL logo
BURL
Burlington Stores Inc
19.31B
BE logo
BE
Bloom Energy Corp
43.67B
what do you think the best bond index is
Intellectia · 38 candidates
Market Cap: >= 15.00BDividend Yield Ttm: 3 - 6Sector: Consumer Cyclicals, Consumer Non-Cyclicals, Real Estate, Telecommunications Services, UtilitiesBeta: LowRiskIs Index Component: GSPC
Ticker
Name
Market Cap$
top bottom
PG logo
PG
Procter & Gamble Co
382.64B
PM logo
PM
Philip Morris International Inc
291.88B
PEP logo
PEP
PepsiCo Inc
229.02B
CMCSA logo
CMCSA
Comcast Corp
110.99B
SO logo
SO
Southern Co
107.85B
DUK logo
DUK
Duke Energy Corp
100.54B
high dividend growth stock
Intellectia · 26 candidates
Market Cap: >= 10.00BDividend Yield Ttm: 2 - 6Eps 5yr Cagr: >= 5Dividend Payout Ratio: 20.00 - 70.00Dividend 5yr Cagr: >= 8
Ticker
Name
Market Cap$
top bottom
MS logo
MS
Morgan Stanley
268.01B
NEE logo
NEE
Nextera Energy Inc
199.35B
NVO logo
NVO
Novo Nordisk A/S
172.30B
TD logo
TD
Toronto-Dominion Bank
159.44B
ACN logo
ACN
Accenture PLC
129.99B
BMO logo
BMO
Bank of Montreal
100.88B
stcks to trade options
Intellectia · 555 candidates
Market Cap: >= 5.00BPrice: $10.00 - $300.00Is Optionable: TrueIs Index Component: GSPC, RUT, DJI, NDXMonthly Average Dollar Volume: >= 1,000,000
Ticker
Name
Market Cap$
top bottom
NI logo
NI
NiSource Inc
22.19B
GDDY logo
GDDY
GoDaddy Inc
12.25B
HWM logo
HWM
Howmet Aerospace Inc
103.48B
SWK logo
SWK
Stanley Black & Decker Inc
14.24B
TGT logo
TGT
Target Corp
52.84B
PTCT logo
PTCT
PTC Therapeutics Inc
5.85B
any stock in the s&p 500
Intellectia · 38 candidates
Price: $20.00 - $200.00Price Change Pct: $2.00 - $8.00Relative Vol: >= 1.50List Exchange: XNYS, XNAS, XASEIs Index Component: GSPCMonthly Average Dollar Volume: >= 5,000,000
Ticker
Name
Market Cap$
top bottom
CCL logo
CCL
Carnival Corp
42.78B
GLW logo
GLW
Corning Inc
83.43B
INTC logo
INTC
Intel Corp
232.07B
ODFL logo
ODFL
Old Dominion Freight Line Inc
36.22B
UAL logo
UAL
United Airlines Holdings Inc
33.12B
NCLH logo
NCLH
Norwegian Cruise Line Holdings Ltd
10.00B
10 best dividend stocks
Intellectia · 34 candidates
Dividend Yield Ttm: 3 - 8Dividend Payout Ratio: 30.00 - 70.00Is Index Component: GSPC, RUT, DJI, NDXFree Cash Flow Ttm: >= 0.000Dividend 5yr Cagr: >= 3
Ticker
Name
Market Cap$
top bottom
ACCO logo
ACCO
ACCO Brands Corp
354.24M
DHT logo
DHT
DHT Holdings Inc
2.22B
F logo
F
Ford Motor Co
54.03B
FNLC logo
FNLC
First Bancorp Inc
301.99M
VICI logo
VICI
VICI Properties Inc
30.50B
KFRC logo
KFRC
Kforce Inc
631.13M
find me qualified stocks or etfs etc
Intellectia · 63 candidates
Market Cap: >= 5.00BDividend Yield Ttm: >= 3Beta: LowRiskPe Ttm: <= 15
Ticker
Name
Market Cap$
top bottom
VZ logo
VZ
Verizon Communications Inc
165.45B
TD logo
TD
Toronto-Dominion Bank
157.05B
PFE logo
PFE
Pfizer Inc
147.20B
TTE logo
TTE
TotalEnergies SE
145.09B
COP logo
COP
ConocoPhillips
120.05B
MO logo
MO
Altria Group Inc
102.53B
long term dividend stocks
Intellectia · 64 candidates
Dividend Yield Ttm: >= 3Beta: LowRisk, ModerateRiskDividend Payout Ratio: <= 60.00Dividend 5yr Cagr: >= 5
Ticker
Name
Market Cap$
top bottom
AMGN logo
AMGN
Amgen Inc
185.02B
TD logo
TD
Toronto-Dominion Bank
157.05B
COP logo
COP
ConocoPhillips
120.05B
BMO logo
BMO
Bank of Montreal
96.25B
AEP logo
AEP
American Electric Power Company Inc
63.55B
TFC logo
TFC
Truist Financial Corp
63.15B
Dividend Paying stocks
Intellectia · 74 candidates
Dividend Yield Ttm: >= 3Dividend Payout Ratio: <= 60.00Dividend 5yr Cagr: >= 5
Ticker
Name
Market Cap$
top bottom
AMGN logo
AMGN
Amgen Inc
185.02B
TD logo
TD
Toronto-Dominion Bank
157.05B
COP logo
COP
ConocoPhillips
120.05B
BMO logo
BMO
Bank of Montreal
96.25B
AEP logo
AEP
American Electric Power Company Inc
63.55B
TFC logo
TFC
Truist Financial Corp
63.15B
divdend stoks in teh
Intellectia · 76 candidates
Market Cap: >= 1000.00MDividend Yield Ttm: >= 3Sector: Consumer Cyclicals, Consumer Non-Cyclicals, Financials, UtilitiesDividend Payout Ratio: <= 60.00
Ticker
Name
Market Cap$
top bottom
CALM logo
CALM
Cal-Maine Foods Inc
3.79B
BBDO logo
BBDO
Banco Bradesco SA
34.76B
BPOP logo
BPOP
Popular Inc
8.57B
CADE logo
CADE
Cadence Bank
8.66B
WFC logo
WFC
Wells Fargo & Co
266.33B
VOYA logo
VOYA
Voya Financial Inc
7.10B

Whales Holding TGT

P
Pacific Investment Management Company LLC
Holding
TGT
+22.95%
3M Return
S
Smead Capital Management, Inc.
Holding
TGT
+8.07%
3M Return
C
Cullen Capital Management, LLC
Holding
TGT
+2.26%
3M Return
C
Cinctive Capital Management LP
Holding
TGT
+2.04%
3M Return
F
Fairholme Capital Management, L.L.C.
Holding
TGT
-0.67%
3M Return
P
Peak6 Group LLC
Holding
TGT
-4.78%
3M Return

Trading Trends

    Insider
    Hedge Fund
    Congress Trading

People Also Watch

Frequently Asked Questions

What is Target Corp (TGT) stock price today?

The current price of TGT is 119.19 USD — it has decreased -0.54

What is Target Corp (TGT)'s business?

Target Corporation is a general merchandise retailer selling products to its guests through its stores and digital channels. The Company offers customers, referred to as guests, everyday essentials and fashionable, differentiated merchandise at discounted prices. The majority of its stores offer a wide assortment of general merchandise and food. Its merchandise categories include apparel and accessories, beauty and household essentials, food and beverage, hardlines, and home furnishings and decor. Most of its stores are larger than 170,000 square feet, offer a variety of general merchandise and a full line of food items comparable to traditional supermarkets. Its digital channels include a wide merchandise and food assortment, including many items found in its stores, along with a complementary assortment sold by the Company and third parties. Its brands include A New Day, Ava & Viv, Cloud Island, Favorite Day, and others. It serves guests at nearly 2,000 stores and at Target.com.

What is the price predicton of TGT Stock?

Wall Street analysts forecast TGT stock price to rise over the next 12 months. According to Wall Street analysts, the average 1-year price target for TGT is98.83 USD with a low forecast of 80.00 USD and a high forecast of 126.00 USD. However, analyst price targets are subjective and often lag stock prices, so investors should focus on the objective reasons behind analyst rating changes, which better reflect the company's fundamentals.

What is Target Corp (TGT)'s revenue for the last quarter?

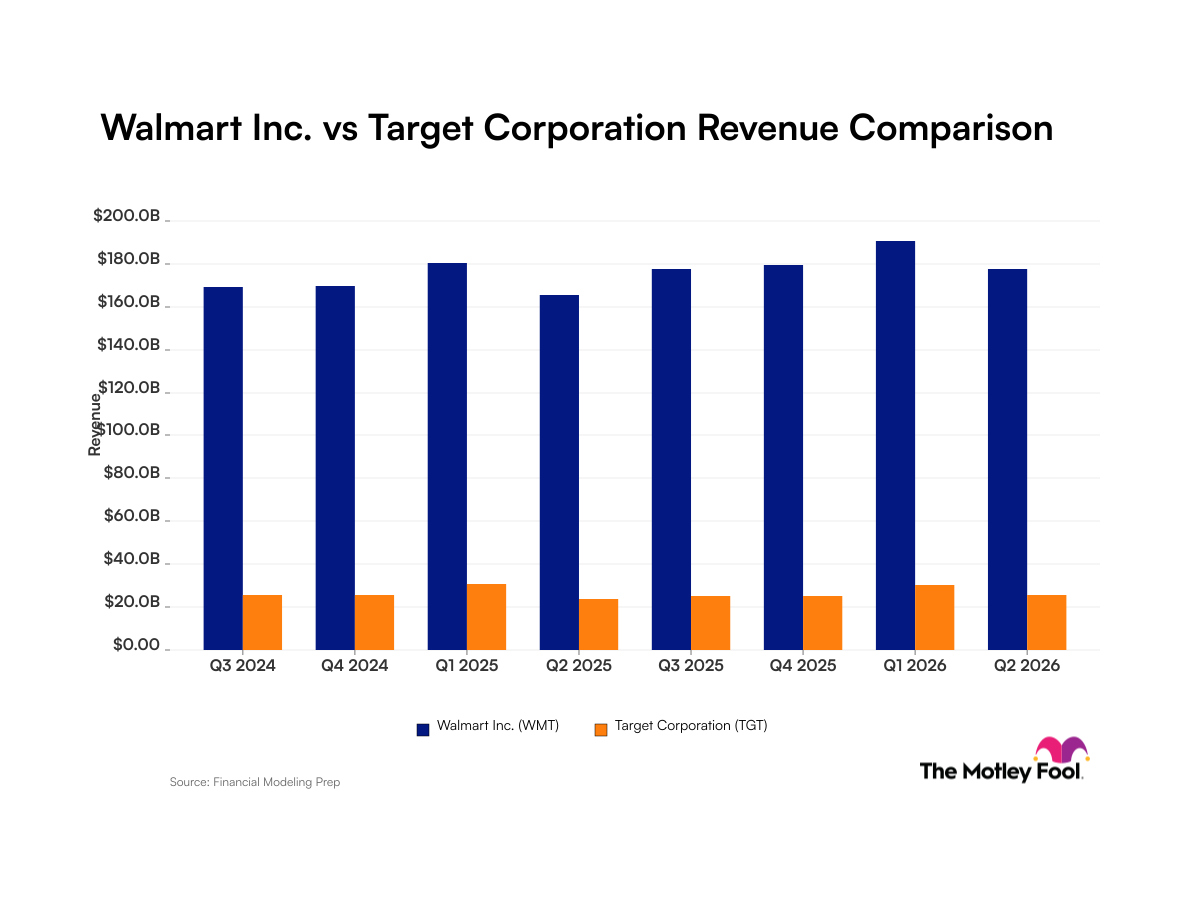
Target Corp revenue for the last quarter amounts to 30.45B USD, decreased -1.49

What is Target Corp (TGT)'s earnings per share (EPS) for the last quarter?

Target Corp. EPS for the last quarter amounts to 2.30 USD, decreased -4.56

How many employees does Target Corp (TGT). have?

Target Corp (TGT) has 415000 emplpoyees as of March 30 2026.

What is Target Corp (TGT) market cap?

Today TGT has the market capitalization of 54.27B USD.