
Line
|

Candle
1D
5D
1M
3M
6M
YTD
1Y
5Y
High
67.750
Open
64.090
VWAP
66.22
Vol
18.22M
Mkt Cap
227.88B
Low
64.020
Amount
1.21B
EV/EBITDA(TTM)
13.27
Total Shares
4.45B
EV
2.06T
EV/OCF(TTM)
15.70
P/S(TTM)
6.53
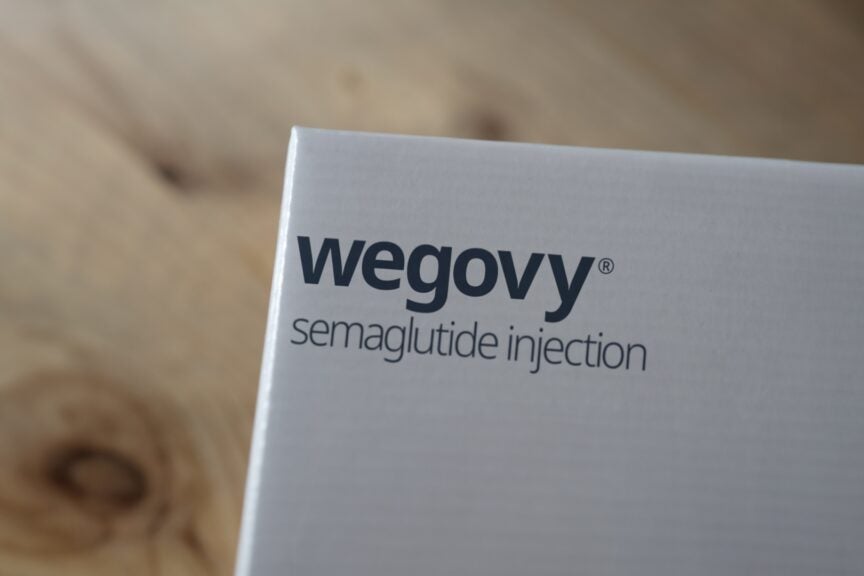
Novo Nordisk A/S is a global healthcare company engaged in diabetes care. The Company is also engaged in the discovery, development, manufacturing and marketing of pharmaceutical products. The Company operates through two business segments: diabetes and obesity care, and biopharmaceuticals. The Company's diabetes and obesity care segment covers insulin, GLP-1, other protein-related products, such as glucagon, protein-related delivery systems and needles, and oral anti-diabetic drugs. The Company's biopharmaceuticals segment covers the therapy areas of hemophilia care, growth hormone therapy and hormone replacement therapy. The Company also offers Saxenda product to treat obesity. It offers a range of products, including NovoLog/NovoRapid; NovoLog Mix/NovoMix; Prandin/NovoNorm; NovoSeven; Norditropin, and Vagifem. As of December 31, 2016, it marketed its products in over 180 countries. Its regional structure consists of two commercial units: North America and International Operations.
Show More
Market Estimates
Earnings Estimates
Revenue
YoY Chg
EPS
YoYChg
FY2025Q4
FY2025Q3
FY2025Q2
93.32B
+8.91%
--
--
84.12B
+17.96%
--
--
78.38B
+15.16%
--
--
Estimates Revision
The market is revising Downward the revenue expectations for Novo Nordisk A/S (NVO) for FY2025, with the revenue forecasts being adjusted by -3.29% over the past three months. During the same period, the stock price has changed by -17.18%.
Revenue Estimates for FY2025
Revise Downward

-3.29%
In Past 3 Month
Stock Price
Go Down

-17.18%
In Past 3 Month
9 Analyst Rating

22.82% Upside
Wall Street analysts forecast NVO stock price to rise over the next 12 months. According to Wall Street analysts, the average 1-year price target for NVO is 83.20 USD with a low forecast of 61.00 USD and a high forecast of 102.00 USD. However, analyst price targets are subjective and often lag stock prices, so investors should focus on the objective reasons behind analyst rating changes, which better reflect the company's fundamentals.
3 Buy
5 Hold
1 Sell
Hold

22.82% Upside
Current: 67.740

Low
61.00
Averages
83.20
High
102.00

22.82% Upside
Current: 67.740

Low
61.00
Averages
83.20
High
102.00
BMO Capital
Evan David Seigerman
Buy
to
Hold
Downgrades
$105 → $64
2025-04-17
Reason
BMO Capital
Evan David Seigerman
Price Target
$105 → $64
2025-04-17
Downgrades
Buy
to
Hold
Reason
BMO Capital downgraded Novo Nordisk (NVO) to Market Perform from Outperform with a price target of $64, down from $105. The company's obesity competitor Eli Lilly (LLY) has made sizable advancements in its commercial and clinical portfolio, causing it to overtake Novo's early lead, the analyst tells investors in a research note. The firm says updates from Lilly's oral GLP1, orforglipron, are likely to pressure Novo shares, which will only be compounded by what it expects to be "softer" Q1 results. BMO is moving to the sidelines until Novo can demonstrate clinical and commercial "prowess."
UBS
Jo Walton
Strong Sell
to
Strong Buy
Upgrades
n/a
2025-01-08
Reason
UBS
Jo Walton
Price Target
n/a
2025-01-08
Upgrades
Strong Sell
to
Strong Buy
Reason
UBS analyst upgraded Novo Nordisk to Buy from Neutral with a price target of DKK 750, down from DKK 1,100. Novo Nordisk is "well placed" to continue to benefit from the high demand for GLP-1 medications in the near-term, and while the CagriSema Phase 3 data in obesity was disappointing, it is still a higher efficacy treatment that could still show differentiation in type 2 diabetes. UBS is a buyer of weakness and says shares are at an attractive entry point following the "overdone" selloff.
BMO Capital
Evan David Seigerman
Buy
Maintains
$156 → $105
2024-12-23
Reason
BMO Capital
Evan David Seigerman
Price Target
$156 → $105
2024-12-23
Maintains
Buy
Reason
BMO Capital lowered the firm's price target on Novo Nordisk (NVO) to $105 from $156 and keeps an Outperform rating on the shares after CagriSema's Phase 3 data readout failed to meet investor expectations. CagriSema was supposed to best Eli Lilly's (LLY) Zepbound, but missed the mark on efficacy and tolerability, which "cuts the margin of error for execution in 2025," so Q4 results "cannot miss and the 2025 guide must be strong," the analyst tells investors. Given the data, the firm is cutting its Novo price target, but thinks the reaction in shares today has been "overdone," the analyst added.
Cantor Fitzgerald
Louise Chen
Buy
Reiterates
$160
2024-11-06
Reason
Cantor Fitzgerald
Louise Chen
Price Target
$160
2024-11-06
Reiterates
Buy
Reason
BMO Capital
Evan David Seigerman
Buy
Maintains
$160 → $156
2024-10-17
Reason
BMO Capital
Evan David Seigerman
Price Target
$160 → $156
2024-10-17
Maintains
Buy
Reason
BMO Capital analyst Evan Seigerman lowered the firm's price target on Novo Nordisk to $156 from $160 and keeps an Outperform rating on the shares as part of a broader research note previewing Q3 results in BioPharma. Looking at script growth for Ozempic and Wegovy from Q2, the firm sees 4% and 24% growth, respectively, but while growth continues to be impressive, sell-side estimates may now be catching up to this growth, the analyst tells investors in a research note. Novo's Victoza scripts have declined nearly 50% from Q2 however as patients and providers transition to more efficacious agents Mounjaro / Ozempic, the firm added.
Cantor Fitzgerald
Louise Chen
Buy
Reiterates
$160
2024-10-10
Reason
Cantor Fitzgerald
Louise Chen
Price Target
$160
2024-10-10
Reiterates
Buy
Reason
See All Ratings
Valuation Metrics
The current forward P/E ratio for Novo Nordisk A/S (NVO.N) is 16.61, compared to its 5-year average forward P/E of 28.65. For a more detailed relative valuation and DCF analysis to assess Novo Nordisk A/S 's fair value, click here.
Forward PE
The forward P/E ratio is a valuation metric that divides a company's current stock price by its estimated future earnings per share over the next 12 months.

Strongly Undervalued
5Y Average PE
28.65
Current PE
16.61
Overvalued PE
34.02
Undervalued PE
23.28
Forward EV/EBITDA
The forward EV/EBITDA ratio is a valuation metric that divides a company's enterprise value (EV) by its estimated future earnings before interest, taxes, depreciation, and amortization (EBITDA) over the next 12 months.

Strongly Undervalued
5Y Average EV/EBITDA
20.44
Current EV/EBITDA
12.39
Overvalued EV/EBITDA
24.18
Undervalued EV/EBITDA
16.69
Forward PS
The forward P/S ratio is a valuation metric that divides a company's current stock price by its estimated future sales (or revenue) per share over the next 12 months.

Strongly Undervalued
5Y Average PS
9.79
Current PS
5.67
Overvalued PS
11.73
Undervalued PS
7.85
Financials
Annual
Quarterly
FY2025Q1
YoY :
+15.63%
11.01B
Total Revenue
FY2025Q1
YoY :
+17.87%
5.47B
Operating Profit
FY2025Q1
YoY :
+10.58%
4.09B
Net Income after Tax
FY2025Q1
YoY :
+10.84%
0.92
EPS - Diluted
FY2025Q1
YoY :
+82.49%
1.41B
Free Cash Flow
FY2025Q1
YoY :
-1.58%
83.49
Gross Profit Margin - %
FY2025Q1
YoY :
+19.45%
24.63
FCF Margin - %
FY2025Q1
YoY :
-4.37%
37.18
Net Margin - %
FY2025Q1
YoY :
-100.00%
N/A
ROIC
Trading Trends
Insider
Insiders are Neutral. There are no significant trading trends over the last month.
Sold
0-3
Months
0.0
USD
0
3-6
Months
0.0
USD
0
6-9
Months
0.0
USD
0
0-12
Months
0.0
USD
0
Bought
0-3
0
0.0
USD
Months
3-6
0
0.0
USD
Months
6-9
0
0.0
USD
Months
0-12
0
0.0
USD
Months
Hedge Fund
Hedge Funds areSelling! The selling amount has increased 764.45% over the last quarter.
Sold
0-3
Months
0.0
Volume
0
3-6
Months
9.8M
Volume
13
6-9
Months
0.0
Volume
0
0-12
Months
1.1M
Volume
31
Bought
0-3
0
0.0
Volume
Months
3-6
15
1.3M
Volume
Months
6-9
0
0.0
Volume
Months
0-12
25
4.3M
Volume
Months
Congress Trading
Congress are Neutral. There are no significant trading trends over the last month.
Sold
0-3
Months
16.0K
USD
2
3-6
Months
0.0
USD
0
6-9
Months
83.0K
USD
2
0-12
Months
0.0
USD
0
Bought
0-3
2
40.5K
USD
Months
3-6
0
0.0
USD
Months
6-9
1
32.5K
USD
Months
0-12
0
0.0
USD
Months
Insider
Insiders are Neutral. There are no significant trading trends over the last month.
Sold
0-3
Months
0.0
USD
0
3-6
Months
0.0
USD
0
6-9
Months
0.0
USD
0
0-12
Months
0.0
USD
0
Bought
0-3
0
0.0
USD
Months
3-6
0
0.0
USD
Months
6-9
0
0.0
USD
Months
0-12
0
0.0
USD
Months
NVO News & Events
Events Timeline
2025-05-12 (ET)
2025-05-12
10:59:57
White House publishes Trump executive order aimed at lowering drug prices


2025-05-12
06:16:19
Many patients soon to be forced to switch obesity drug, NYT says


2025-05-07 (ET)
2025-05-07
09:30:10
Novo Nordisk CFO skeptical Trump EO can cut production timelines, Reuters says


Sign Up For More Events
News
9.0
13:24 PMBenzingaPinnedNovo Nordisk's Sogroya Supports Effective Weekly Alternative To Daily Hormone Therapy Across Three Growth Disorders
9.0
09:00 AMNASDAQ.COMPinnedNovo Nordisk's Sogroya Shows Tolerability In Children With Growth Disorders
6.5
17:39 PMCNBCJim Cramer says investors shouldn't chase Monday's market rally — here's why
Sign Up For More News
People Also Watch

NGNE
Neurogene Inc
17.750
USD
+20.50%

AEVA
Aeva Technologies Inc
13.025
USD
+17.13%

ATAI
ATAI Life Sciences NV
1.430
USD
+2.88%

DMAC
DiaMedica Therapeutics Inc
3.800
USD
+3.83%

TCI
Transcontinental Realty Investors Inc
36.040
USD
+9.21%

GRRR
Gorilla Technology Group Inc
17.560
USD
+8.87%

LFCR
Lifecore Biomedical Inc
6.990
USD
+0.29%

HLXB
Helix Acquisition Corp II
10.850
USD
0.00%

EVI
EVI Industries Inc
15.960
USD
+2.37%

TZOO
Travelzoo
14.245
USD
-2.83%
FAQ

What is Novo Nordisk A/S (NVO) stock price today?
The current price of NVO is 67.74 USD — it has increased 3 % in the last trading day.

What is Novo Nordisk A/S (NVO)'s business?

What is the price predicton of NVO Stock?

What is Novo Nordisk A/S (NVO)'s revenue for the last quarter?

What is Novo Nordisk A/S (NVO)'s earnings per share (EPS) for the last quarter?

What changes have occurred in the market's expectations for Novo Nordisk A/S (NVO)'s fundamentals?

How many employees does Novo Nordisk A/S (NVO). have?
