$
105.940
+0.820(+0.780%)
  • Overview
  • Forecast
  • Valuation
Line
Line
|
Candle
Candle
1D
5D
1M
3M
6M
YTD
1Y
5Y
High
106.190
Open
105.255
VWAP
105.71
Vol
10.44M
Mkt Cap
190.45B
Low
104.760
Amount
1.10B
EV/EBITDA(TTM)
12.32
Total Shares
1.82B
EV
231.92B
EV/OCF(TTM)
12.83
P/S(TTM)
2.05
The Walt Disney Company is a diversified worldwide entertainment company. The Company's segments include Entertainment, Sports and Experiences. The Entertainment segment generally encompasses the Company’s non-sports focused global film, television and direct-to-consumer (DTC) video streaming content production and distribution activities. Its line of business includes Linear Networks, Direct-to-Consumer, and Content Sales/Licensing. The Sports segment generally encompasses the Company’s sports-focused global television and DTC video streaming content production and distribution activities. Its line of business includes ESPN and Star. Experiences segment includes Parks and Experiences and Consumer Products. Parks and Experiences consists of Walt Disney World Resort in Florida, Disneyland Resort in California, Disney Cruise Line, Disney Vacation Club, and Disneyland Paris, among others. Consumer Products includes licensing of its trade names, characters, visual, literary and other IPs.
Show More

Market Estimates

Earnings Estimates
Revenue
YoY Chg
EPS
YoYChg
FY2026Q1
FY2025Q4
FY2025Q3
25.77B
+4.37%
1.724
-2.02%
22.99B
+1.86%
1.111
-2.59%
23.69B
+2.29%
1.438
+3.42%
Estimates Revision
The market is revising Upward the revenue expectations for The Walt Disney Company (DIS) for FY2025, with the revenue forecasts being adjusted by 0.47% over the past three months. During the same period, the stock price has changed by -2.83%.
Revenue Estimates for FY2025
Revise Upward
up Image
+0.47%
In Past 3 Month
EPS Estimates for FY2025
Revise Upward
up Image
+2.83%
In Past 3 Month
Stock Price
Go Down
down Image
-2.83%
In Past 3 Month
20 Analyst Rating
up Image
18.24% Upside
Wall Street analysts forecast DIS stock price to rise over the next 12 months. According to Wall Street analysts, the average 1-year price target for DIS is 125.26 USD with a low forecast of 105.00 USD and a high forecast of 140.00  USD. However, analyst price targets are subjective and often lag stock prices, so investors should focus on the objective reasons behind analyst rating changes, which better reflect the company's fundamentals.
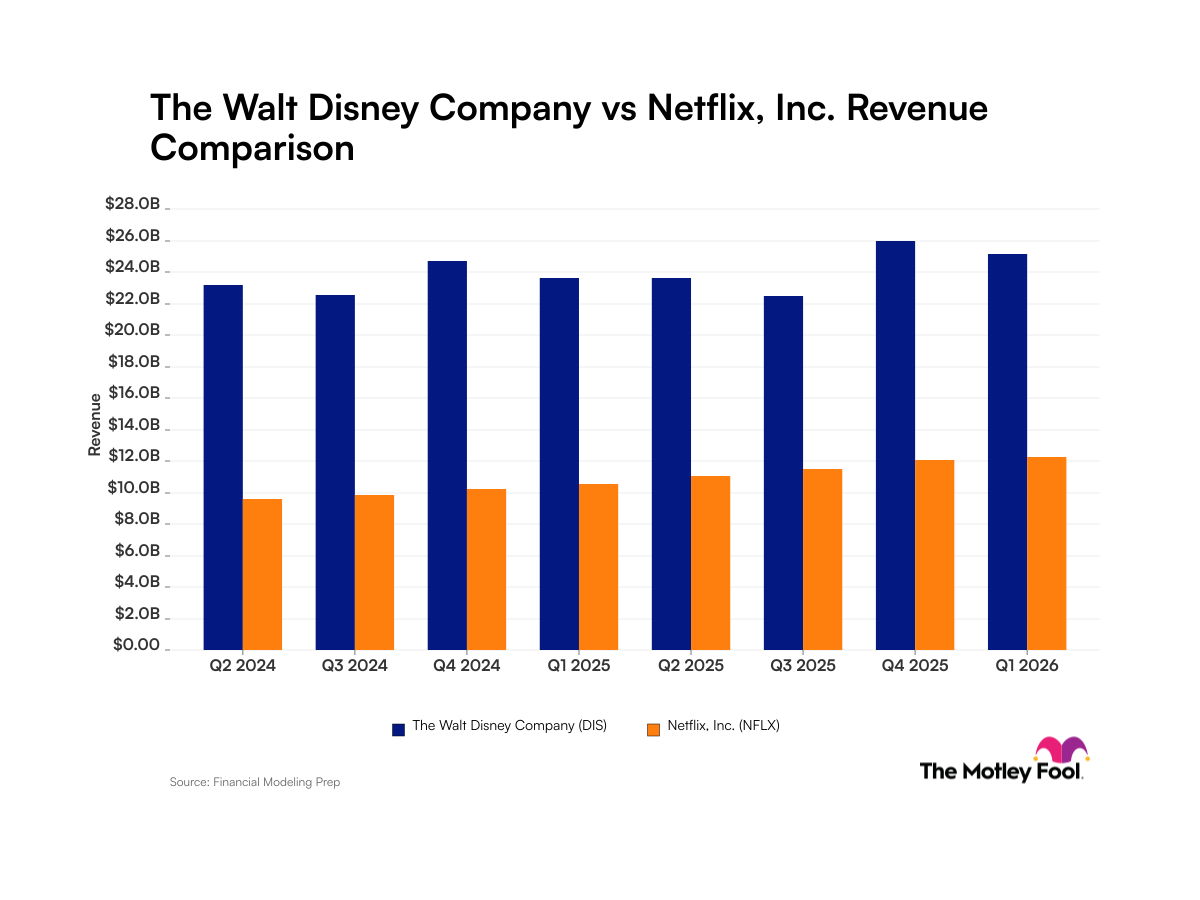
16 Buy
4 Hold
0 Sell
Strong Buy
up Image
18.24% Upside
Current: 105.940
sliders
Low
105.00
Averages
125.26
High
140.00
Needham
Laura Martin
Strong Buy
Reiterates
$125
2025-05-08
New
Reason
Guggenheim
Michael Morris
Strong Buy
Maintains
$130 → $120
2025-05-08
New
Reason
Morgan Stanley
Benjamin Swinburne
Buy
Maintains
$110 → $120
2025-05-08
New
Reason
Barclays
Kannan Venkateshwar
Buy
Maintains
$115 → $120
2025-05-08
New
Reason
Loop Capital
Alan Gould
Strong Buy
Maintains
$120 → $125
2025-05-08
New
Reason
UBS
John Hodulik
Strong Buy
Maintains
$105 → $120
2025-05-08
New
Reason

Valuation Metrics

The current forward P/E ratio for Walt Disney Co (DIS.N) is 18.30, compared to its 5-year average forward P/E of 53.30. For a more detailed relative valuation and DCF analysis to assess Walt Disney Co 's fair value, click here.

Forward PE

StronglyUndervaluedUndervaluedFairOvervaluedStronglyOvervalueddotted line Image
N/A
5Y Average PE
53.30
Current PE
18.30
Overvalued PE
164.49
Undervalued PE
-57.88

Forward EV/EBITDA

StronglyUndervaluedUndervaluedFairOvervaluedStronglyOvervalueddotted line Image
Fair
5Y Average EV/EBITDA
19.46
Current EV/EBITDA
11.14
Overvalued EV/EBITDA
28.69
Undervalued EV/EBITDA
10.24

Forward PS

StronglyUndervaluedUndervaluedFairOvervaluedStronglyOvervalueddotted line Image
Fair
5Y Average PS
2.64
Current PS
1.96
Overvalued PS
3.59
Undervalued PS
1.70

Financials

Annual
Quarterly
FY2025Q2
YoY :
+6.96%
23.62B
Total Revenue
FY2025Q2
YoY :
+21.78%
3.51B
Operating Profit
FY2025Q2
YoY :
+1474.54%
3.40B
Net Income after Tax
FY2025Q2
YoY :
-18200.00%
1.81
EPS - Diluted
FY2025Q2
YoY :
+103.20%
4.89B
Free Cash Flow
FY2025Q2
YoY :
+4.97%
31.70
Gross Profit Margin - %
FY2025Q2
YoY :
+23.69%
11.59
FCF Margin - %
FY2025Q2
YoY :
+1369.39%
14.40
Net Margin - %
FY2025Q2
YoY :
+254.77%
7.06
ROIC

Trading Trends

Insider
Insiders are Neutral. There are no significant trading trends over the last month.
Sold
0-3
Months
0.0
USD
0
3-6
Months
1.3M
USD
3
6-9
Months
43.5M
USD
3
0-12
Months
0.0
USD
0
Bought
0-3
0
0.0
USD
Months
3-6
0
0.0
USD
Months
6-9
0
0.0
USD
Months
0-12
0
0.0
USD
Months
Hedge Fund
Hedge Funds areBuying! The buying amount has increased 12524.65% over the last quarter.
Sold
0-3
Months
0.0
Volume
0
3-6
Months
4.6M
Volume
38
6-9
Months
0.0
Volume
0
0-12
Months
65.7M
Volume
83
Bought
0-3
0
0.0
Volume
Months
3-6
16
2.1M
Volume
Months
6-9
1
16.8K
Volume
Months
0-12
41
6.4M
Volume
Months
Congress Trading
Congress are Neutral. There are no significant trading trends over the last month.
Sold
0-3
Months
121.5K
USD
6
3-6
Months
56.5K
USD
4
6-9
Months
16.0K
USD
2
0-12
Months
8.0K
USD
1
Bought
0-3
0
0.0
USD
Months
3-6
1
8.0K
USD
Months
6-9
1
32.5K
USD
Months
0-12
0
0.0
USD
Months

DIS News & Events

Events Timeline

2025-05-07 (ET)
2025-05-07
10:37:54
Disney CFO says confidence comes from 'what we see in our own data'
select
2025-05-07
09:55:01
Early notable gainers among liquid option names on May 7th
select
2025-05-07
09:03:08
Disney says outlook 'still quite strong' for Experiences business
select
Sign Up For More Events

News

9.5
05-08TipRanks
PinnedIs Disney Stock (DIS) a Buy After Earnings?
9.5
05-08SeekingAlpha
PinnedAnalyst continue to stay bullish on Disney post earnings
2.0
05-10WSJ
Is Disney World on the Cheap Still Any Fun?
Sign Up For More News

FAQ

arrow icon

What is Walt Disney Co (DIS) stock price today?

The current price of DIS is 105.94 USD — it has increased 0.78 % in the last trading day.

arrow icon

What is Walt Disney Co (DIS)'s business?

arrow icon

What is the price predicton of DIS Stock?

arrow icon

What is Walt Disney Co (DIS)'s revenue for the last quarter?

arrow icon

What is Walt Disney Co (DIS)'s earnings per share (EPS) for the last quarter?

arrow icon

What changes have occurred in the market's expectations for Walt Disney Co (DIS)'s fundamentals?

arrow icon

How many employees does Walt Disney Co (DIS). have?

arrow icon

What is Walt Disney Co (DIS) market cap?