ASML Overview
-
$
0.000
0.000(0.000%)
At close0.000(0.000%)Aft-market
ET
Loading chart...

The current price of ASML is 1776.82 USD — it has increased 1.69
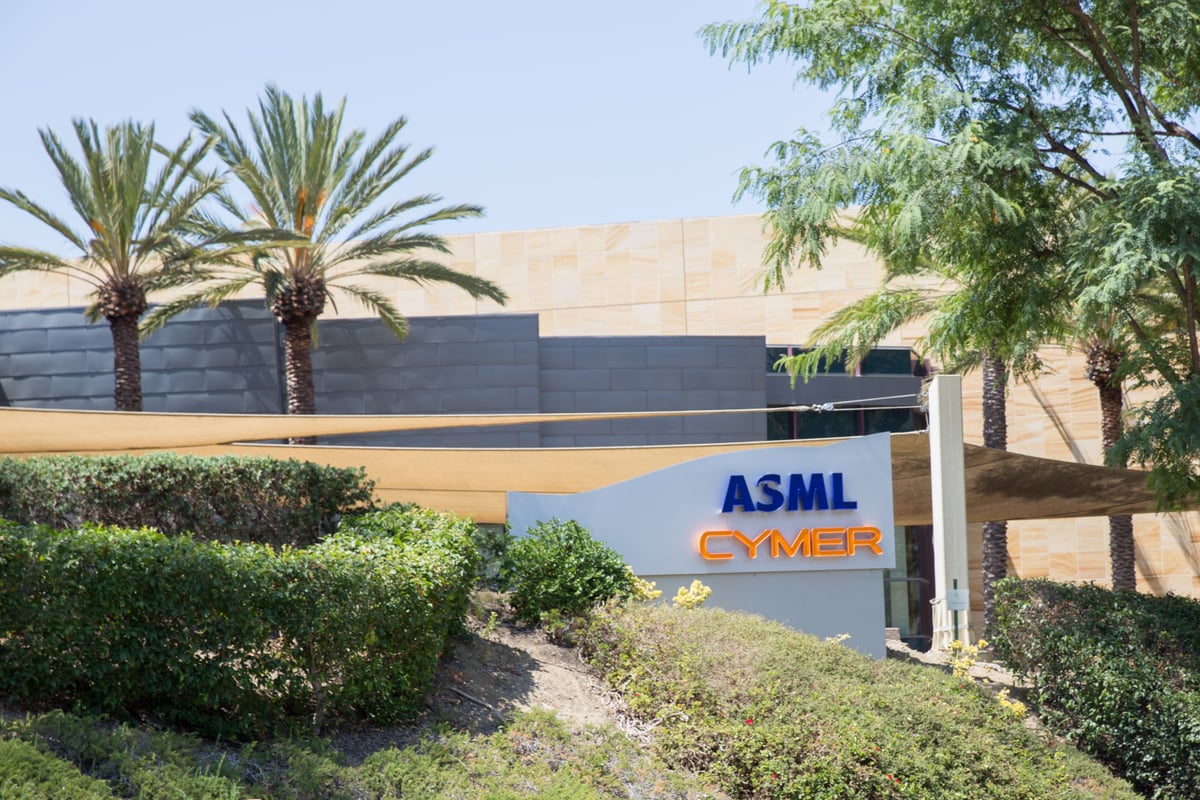
ASML Holding N.V. is a holding company based in the Netherlands. The Company operates through its subsidiaries in the Netherlands, the United States, Italy, France, Germany, the United Kingdom, Ireland, Belgium, South Korea, Taiwan, Singapore, China, Hong Kong, Japan, Malaysia and Israel. The Company operates through one business segment which is engage in development, production, marketing, sales, upgrading and servicing of advanced semiconductor equipment systems, consisting of lithography, metrology and inspection systems. The Company offers TWINSCAN systems, equipped with lithography system with a mercury lamp as light source (i-line), Krypton Fluoride (KrF) and Argon Fluoride (ArF) light sources for processing wafers for manufacturing environments for which imaging at a small resolution is required. TWINSCAN systems also include immersion lithography systems (TWINSCAN immersion systems).
Wall Street analysts forecast ASML stock price to rise over the next 12 months. According to Wall Street analysts, the average 1-year price target for ASML is1583 USD with a low forecast of 1385 USD and a high forecast of 1911 USD. However, analyst price targets are subjective and often lag stock prices, so investors should focus on the objective reasons behind analyst rating changes, which better reflect the company's fundamentals.
ASML Holding NV revenue for the last quarter amounts to 10.26B USD, increased 26.15
ASML Holding NV. EPS for the last quarter amounts to 8.37 USD, increased 32.65
ASML Holding NV (ASML) has 43520 emplpoyees as of July 08 2026.
Today ASML has the market capitalization of 673.43B USD.