
HMC
Honda Motor Co Ltd
- Overview
- Forecast
- Valuation
- Earnings

Line
|

Candle
1D
5D
1M
3M
6M
YTD
1Y
5Y
High
32.780
Open
32.770
VWAP
32.64
Vol
1.24M
Mkt Cap
171.92B
Low
32.555
Amount
40.55M
EV/EBITDA(TTM)
9.45
Total Shares
1.61B
EV
16.13T
EV/OCF(TTM)
35.14
P/S(TTM)
0.34
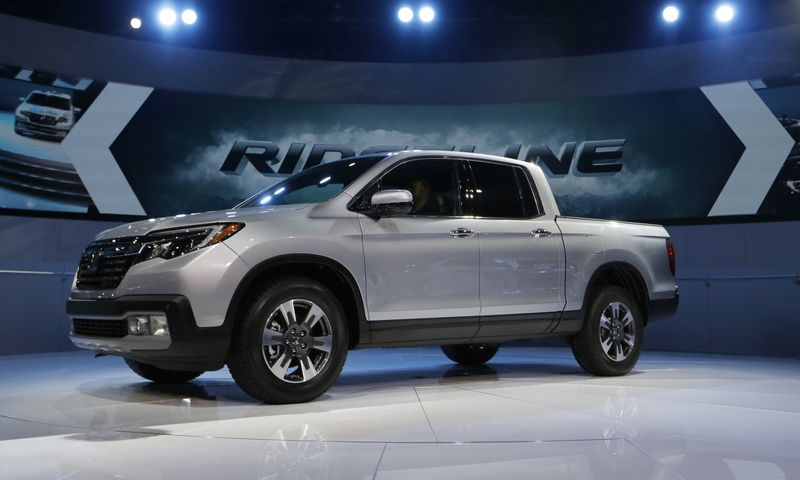
Honda Motor Co Ltd is a Japan-based company principally engaged in the motorcycle business, the automobile business, the financial service business and the life creation business. The Company operates through four business segments. The Motorcycle segment is engaged in the research and development, production and sale of motorcycles, all-terrain vehicles (ATVs), side-by-side vehicles and related parts. The Automobile segment is engaged in the research and development, production and sale of automobiles and related parts. The Financial Service segment is engaged in the sales financing and leasing of its products. The Power Products and Other Business segment is engaged in the research and development, production and sale of power products and related parts.
Show More
Market Estimates
Earnings Estimates
Revenue
YoY Chg
EPS
YoYChg
FY2026Q2
FY2026Q3
FY2026Q4
5.27T
-2.31%
--
--
5.33T
-3.7%
--
--
5.26T
-1.95%
--
--
Estimates Revision
The market is revising Downward the revenue expectations for Honda Motor Co., Ltd. (HMC) for FY2026, with the revenue forecasts being adjusted by -2.66% over the past three months. During the same period, the stock price has changed by 6.86%.
Revenue Estimates for FY2026
Revise Downward

-2.66%
In Past 3 Month
Stock Price
Go Up

+6.86%
In Past 3 Month
Valuation Metrics
The current forward P/E ratio for Honda Motor Co Ltd (HMC.N) is 12.30, compared to its 5-year average forward P/E of 7.13. For a more detailed relative valuation and DCF analysis to assess Honda Motor Co Ltd 's fair value, click here.
Forward PE
The forward P/E ratio is a valuation metric that divides a company's current stock price by its estimated future earnings per share over the next 12 months.

Strongly Overvalued
5Y Average PE
7.13
Current PE
12.30
Overvalued PE
9.49
Undervalued PE
4.78
Forward EV/EBITDA
The forward EV/EBITDA ratio is a valuation metric that divides a company's enterprise value (EV) by its estimated future earnings before interest, taxes, depreciation, and amortization (EBITDA) over the next 12 months.

Fair
5Y Average EV/EBITDA
7.52
Current EV/EBITDA
8.14
Overvalued EV/EBITDA
9.01
Undervalued EV/EBITDA
6.03
Forward PS
The forward P/S ratio is a valuation metric that divides a company's current stock price by its estimated future sales (or revenue) per share over the next 12 months.

Undervalued
5Y Average PS
0.34
Current PS
0.30
Overvalued PS
0.38
Undervalued PS
0.30
Financials
Annual
Quarterly
FY2026Q1
YoY :
+6.47%
36.92B
Total Revenue
FY2026Q1
YoY :
-45.72%
1.69B
Operating Profit
FY2026Q1
YoY :
-44.11%
1.49B
Net Income after Tax
FY2026Q1
YoY :
-38.46%
0.32
EPS - Diluted
FY2026Q1
YoY :
-57.17%
-793.29M
Free Cash Flow
FY2026Q1
YoY :
-9.44%
20.05
Gross Profit Margin - %
FY2026Q1
N/A
FCF Margin - %
FY2026Q1
YoY :
-47.59%
4.02
Net Margin - %
FY2026Q1
N/A
ROIC
Trading Trends
Insider
Insiders are Neutral. There are no significant trading trends over the last month.
Sold
0-3
Months
0.0
USD
0
3-6
Months
0.0
USD
0
6-9
Months
0.0
USD
0
0-12
Months
0.0
USD
0
Bought
0-3
0
0.0
USD
Months
3-6
0
0.0
USD
Months
6-9
0
0.0
USD
Months
0-12
0
0.0
USD
Months
Hedge Fund
Hedge Funds are Neutral. There are no significant trading trends over the last quarter.
Sold
0-3
Months
9.1M
Volume
1
3-6
Months
0.0
Volume
0
6-9
Months
0.0
Volume
0
0-12
Months
0.0
Volume
0
Bought
0-3
0
0.0
Volume
Months
3-6
1
6.6K
Volume
Months
6-9
2
11.9M
Volume
Months
0-12
1
19.1M
Volume
Months
Congress Trading
Congress are Neutral. There are no significant trading trends over the last month.
Sold
0-3
Months
0.0
USD
0
3-6
Months
0.0
USD
0
6-9
Months
0.0
USD
0
0-12
Months
0.0
USD
0
Bought
0-3
0
0.0
USD
Months
3-6
0
0.0
USD
Months
6-9
0
0.0
USD
Months
0-12
0
0.0
USD
Months
Insider
Insiders are Neutral. There are no significant trading trends over the last month.
Sold
0-3
Months
0.0
USD
0
3-6
Months
0.0
USD
0
6-9
Months
0.0
USD
0
0-12
Months
0.0
USD
0
Bought
0-3
0
0.0
USD
Months
3-6
0
0.0
USD
Months
6-9
0
0.0
USD
Months
0-12
0
0.0
USD
Months
HMC News & Events
Events Timeline
2025-08-06 (ET)
2025-08-06
06:26:21
Honda sees FY26 EPS Y105.07

2025-08-06
06:23:41
Honda reports Q1 EPS Y46.80 vs. Y81.81 last year

2025-08-01 (ET)
2025-08-01
12:03:40
Honda reports U.S. July sales up 0.2% to 121,017 vehicles

Sign Up For More Events
News
6.5
08-08NASDAQ.COMZacks Industry Outlook Highlights Honda Motor, Geely Automobile Holdings and NIO
8.0
08-07TipRanksToyota Stock (TM) Crashes as it Faces $9.5B Trump Tariff Hit
9.5
08-06CNBCHonda Motor quarterly profit halves as U.S. auto tariffs bite
Sign Up For More News
People Also Watch

TEL
TE Connectivity PLC
201.980
USD
+1.03%

LYG
Lloyds Banking Group PLC
4.400
USD
+1.38%

FAST
Fastenal Co
47.990
USD
+1.07%

KDP
Keurig Dr Pepper Inc
34.420
USD
+1.53%

PRU
Prudential Financial Inc
103.300
USD
+2.60%

CTVA
Corteva Inc
70.910
USD
-0.20%

HOOD
Robinhood Markets Inc
114.630
USD
+3.06%

GLW
Corning Inc
65.770
USD
+1.56%

AEM
Agnico Eagle Mines Ltd
135.610
USD
-0.13%

RBLX
Roblox Corp
128.710
USD
-0.71%
FAQ

What is Honda Motor Co Ltd (HMC) stock price today?
The current price of HMC is 32.56 USD — it has increased 3.5 % in the last trading day.

What is Honda Motor Co Ltd (HMC)'s business?

What is the price predicton of HMC Stock?

What is Honda Motor Co Ltd (HMC)'s revenue for the last quarter?

What is Honda Motor Co Ltd (HMC)'s earnings per share (EPS) for the last quarter?

What changes have occurred in the market's expectations for Honda Motor Co Ltd (HMC)'s fundamentals?

How many employees does Honda Motor Co Ltd (HMC). have?
