CEG Overview
-
$
0.000
0.000(0.000%)
At close0.000(0.000%)Aft-market
ET
Loading chart...

The current price of CEG is 307.81 USD — it has decreased -1.66
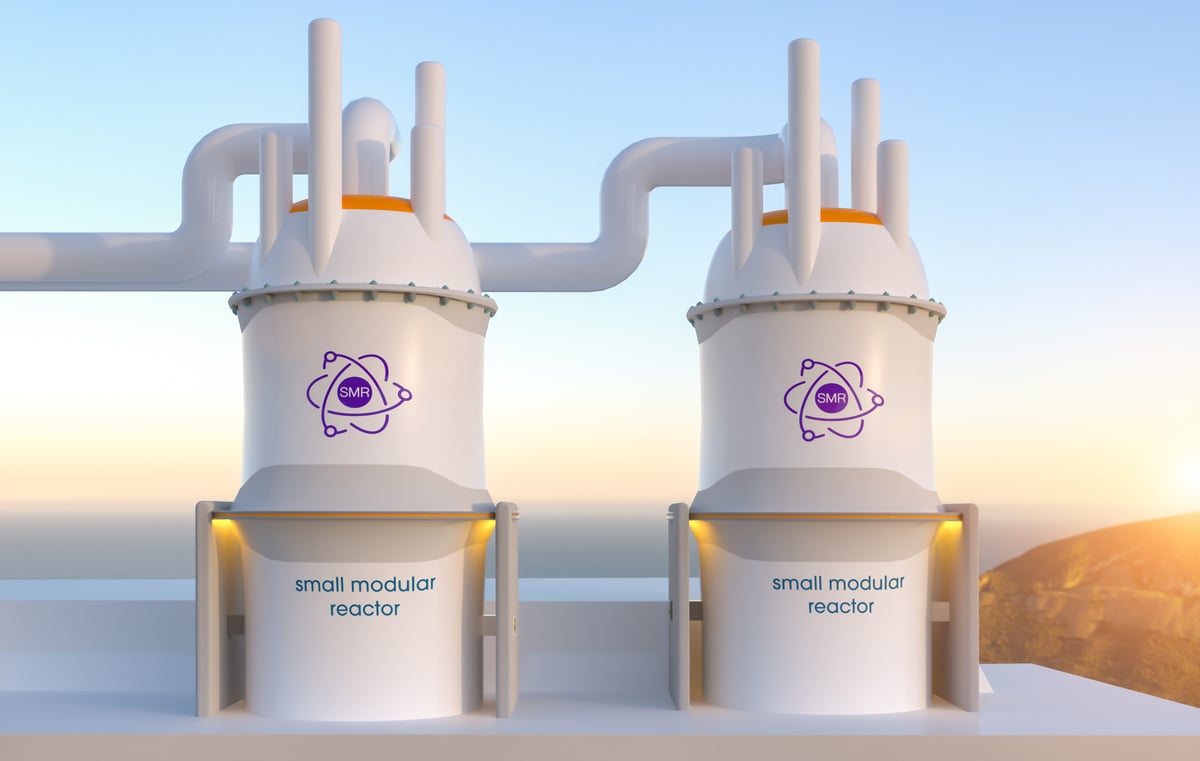
Constellation Energy Corporation is a producer of emissions-free energy and an energy supplier to businesses, homes and public sector customers nationwide. The Company’s nuclear, hydro, wind, and solar generation facilities have the generating capacity to power the equivalent of 27 million homes, providing about 10% of the nation’s clean energy. Its segments include Mid-Atlantic, Midwest, New York, ERCOT, and Other Power Regions. Through its integrated business operations, it sells electricity, natural gas, and other energy-related products and sustainable solutions to various types of customers, including distribution utilities, municipalities, cooperatives, commercial, industrial, public sector, and residential customers in markets across multiple geographic regions. It operates approximately 55 gigawatts of capacity from nuclear, natural gas, geothermal, hydro, wind and solar facilities.
Wall Street analysts forecast CEG stock price to rise over the next 12 months. According to Wall Street analysts, the average 1-year price target for CEG is414.86 USD with a low forecast of 350.00 USD and a high forecast of 460.00 USD. However, analyst price targets are subjective and often lag stock prices, so investors should focus on the objective reasons behind analyst rating changes, which better reflect the company's fundamentals.
Constellation Energy Corp revenue for the last quarter amounts to 6.07B USD, increased 12.86
Constellation Energy Corp. EPS for the last quarter amounts to 1.38 USD, decreased -48.89
Constellation Energy Corp (CEG) has 15291 emplpoyees as of May 03 2026.
Today CEG has the market capitalization of 111.52B USD.