Loading...

Intellectia LogoIntellectia
AI Trading Bot
Features
Markets
News
Resources
Pricing
Get Started
  1. Home
  2. Stock
  3. KO
KO logo

KO Overview

-
$
0.000
0.000(0.000%)
At close
0.000(0.000%)Aft-market
ET
$
0.000
0.000(0.000%)
At close
0.000(0.000%)Aft-market
ET
OverviewStock Price PredictionTechnicalValuationFinancialsEarningsShould I BuyNews & Events
an image of Intellectia Logoan image of Intellectia

Most Trusted AI Platform for Winning Trades

TwitterYoutubeQuoraDiscordLinkedinTelegram

Copyright © 2026 Intellectia.AI. All Rights Reserved.

Company

  • Home
  • Contact
  • About Us
  • Press
  • Privacy
  • Terms of Service
  • Service Terms of Use

Resources

  • Blog
  • Tutorial
  • Help Center
  • Affiliate Program

Markets

  • Market Analysis
  • Crypto
  • Featured Screeners
  • AI Earnings Calendar
  • Market Movers
  • Stock Monitor
  • Economic Calendar
  • All US Stocks
  • All Cryptos

Tools

  • Dividend Calculator
  • Dividend Yield Calculator
  • Options Profit Calculator

Features

  • QuantAI Alpha Pick
  • SwingMax Portfolio
  • Swing Trading
  • AI Stock Picker
  • Whales Auto Tracker
  • Daytrading Center
  • Patterns Detection
  • AI Screener
  • Financial AI Agent
  • Backtesting Playground
  • AI Earnings Prediction
  • Stock Monitor
  • Technical Analysis

News

  • Overview
  • Top News
  • Daily Market Brief
  • Earnings Analysis
  • Newswire
  • Stock News
  • Crypto News
  • Institution News
  • Congress News
  • Monitor News

Compare

  • TradingView
  • SeekingAlpha
Intellectia

Loading chart...

High
80.320
Open
80.040
VWAP
79.86
Vol
4.46M
Mkt Cap
351.17B
Low
79.480
Amount
355.91M
EV/EBITDA(TTM)
22.93
Total Shares
4.30B
EV
383.34B
EV/OCF(TTM)
26.20
P/S(TTM)
7.14
The Coca-Cola Company is a beverage company. The Company's segments include Europe, Middle East and Africa (EMEA); Latin America; North America; Asia Pacific, and Bottling Investments. It sells multiple brands across several beverage categories worldwide. Its portfolio of sparkling soft drink brands includes Coca-Cola, Sprite and Fanta. Its water, sports, coffee and tea brands include Dasani, smartwater, vitaminwater, Topo Chico, BODYARMOR, Powerade, Costa, Georgia, Fuze Tea, Gold Peak and Ayataka. Its juice, value-added dairy and plant-based beverage brands include Minute Maid, Simply, innocent, Del Valle, fairlife and Santa Clara. It operates in two lines of business: concentrate operations and finished product operations. Its concentrate operations sell beverage concentrates, syrups, including fountain syrups, and certain finished beverages to authorized bottling operations. Its finished product operations sell sparkling soft drinks and a variety of other finished beverages.
Show More

Events Timeline

No data

No data

News

Fool
8.5
11:06 AMFool
Analysis of High-Yield Dividend ETF Investments
  • Overview of High-Yield ETFs: The Vanguard High Dividend Yield ETF (VYM) includes 608 stocks with a current dividend yield of 2.24%, and while it has underperformed the S&P 500 over the past five years, it has outperformed it in 2026, indicating its potential for providing steady income during volatile periods.
  • Portfolio Diversification: VYM's largest sector is financials (20.2%), followed by technology (14.8%) and industrials (14.2%), allowing investors to diversify risks across different economic sectors and reduce reliance on a single industry.
  • Schwab Dividend ETF Performance: The Schwab U.S. Dividend Equity ETF (SCHD) holds 103 stocks with a dividend yield of 3.29%, and although its long-term performance has lagged behind VYM and the S&P 500, it has shown strong performance in 2026 with a year-to-date total return of about 17.8%.
  • Considerations for ETF Selection: When choosing between VYM and SCHD, investors should consider diversification and safety, as VYM offers greater diversification with 608 stocks, while SCHD is more attractive in terms of dividend yield, making it suitable for those seeking stable income.
NASDAQ.COM
9.5
11:04 AMNASDAQ.COM
Vanguard High Dividend ETF Underperforms S&P 500
  • Long-Term Performance: The Vanguard High Dividend Yield ETF has an annualized return of 11.9% over the past five years, and while it has shown strong performance in 2026, it still lags behind the S&P 500, indicating relative weakness in market volatility.
  • Expense Ratio Advantage: With an ultra-low expense ratio of 0.04% for the Vanguard ETF and 0.06% for the Schwab U.S. Dividend Equity ETF, both funds are competitively positioned for cost-conscious investors seeking steady income.
  • Portfolio Diversification: The Vanguard ETF holds 608 stocks across various sectors, particularly in finance and technology, providing better diversification compared to the Schwab ETF's 103 stocks, thereby reducing single-sector risk.
  • Dividend Yield Comparison: The Vanguard ETF offers a dividend yield of 2.24%, while the Schwab ETF provides a higher yield of 3.29%; despite the Schwab ETF's attractiveness in yield, the Vanguard's diversified portfolio may better withstand market fluctuations.
Fool
8.5
10:06 AMFool
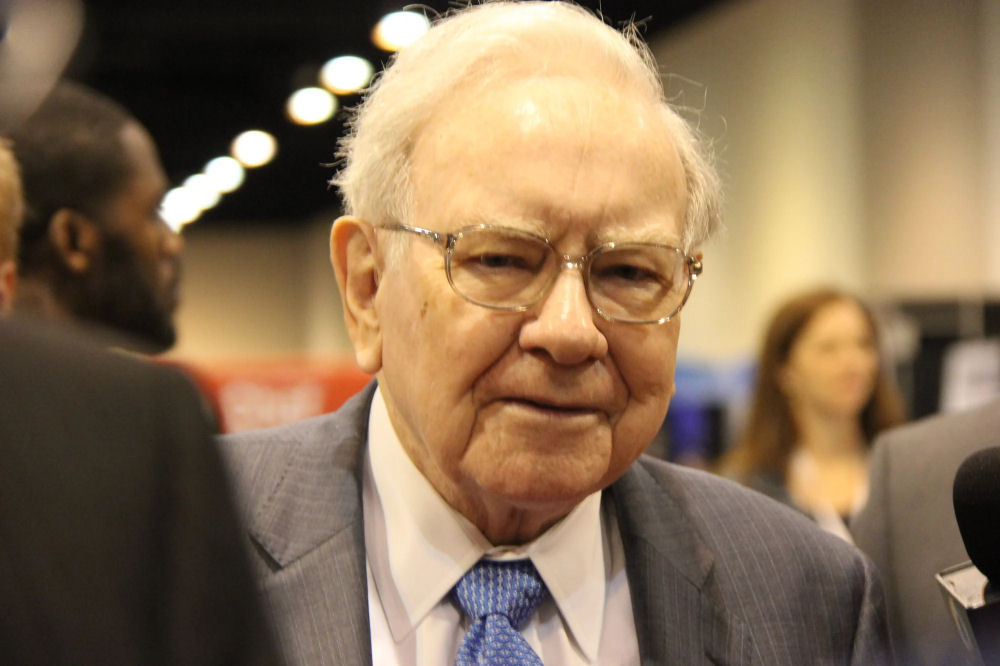
Buffett's Investment Legacy Continues
  • American Express Success: Buffett's investment in American Express since 1964, holding 22% of shares, has resulted in consistent profitability despite economic fluctuations, and is expected to continue generating substantial returns for Berkshire.
  • Alphabet's Diversified Growth: Alphabet's annual revenue surged from $258 billion to nearly $403 billion over the past five years, with its core search engine and cloud services performing strongly, laying a solid foundation for future growth despite some businesses not yet being profitable.
  • Apple's Market Leadership: With a market value exceeding $700 billion, Apple remains a significant holding for Berkshire, as its products and services continue to thrive, particularly in the services ecosystem, ensuring future growth potential.
  • Coca-Cola's High-Profit Model: Coca-Cola operates with net profit margins in the mid-20% range and has consistently increased its dividends, earning the title of 'Dividend King', with a business model that relies on selling foundational syrups, ensuring stable cash flow and long-term investor returns.
Fool
8.5
05-28Fool
Buffett's Recommended Investment Strategy
  • Investment Philosophy: Buffett has successfully achieved a market-beating compounded annual gain over 60 years by identifying companies with competitive advantages and strong management, showcasing his investment acumen and long-term holding strategy.
  • Recommended Asset: The investment Buffett frequently endorses is the S&P 500 index fund, which he believes offers non-professional investors exposure to a wide array of quality companies, with its low-cost nature making it particularly appealing.
  • Long-Term Returns: Since its inception in the late 1950s, the S&P 500 has posted an average annual return of 10%, indicating that by investing in this ETF, investors can avoid the stress of stock selection and are likely to see wealth growth over the long term.
  • Power of Compounding: Assuming an initial investment of $1,000 with an additional $300 monthly for 35 years, the investment could exceed $1 million, demonstrating the power of compounding and encouraging investors to adhere to a long-term investment strategy.
CNBC
6.5
05-26CNBC
JPMorgan Identifies Buying Opportunity in Low Volatility Stocks
  • Attractive Low Volatility Stocks: JPMorgan highlights that low volatility stocks have underperformed in recent months, particularly during the Middle East conflict, with U.S. low vol stocks down 6% while bond yields rose by 55 basis points, indicating an inverse correlation that presents a potential buying opportunity for investors now.
  • Coca-Cola's Resilience: Coca-Cola offers a 2.6% dividend yield and, despite minimal price movement over the past three months, reported first-quarter earnings that exceeded expectations and raised its full-year EPS growth forecast to 8%-9%, demonstrating the company's resilience amid uncertainty.
  • Rollins' Market Outlook: Rollins provides a 1.37% dividend yield and, despite an 11% decline in share price over the last three months, has received strong praise from analysts for its unique market strategy and service culture, suggesting continued industry-leading execution.
  • Procter & Gamble's Challenges and Opportunities: Procter & Gamble, with a 3.01% dividend yield, has seen its stock fall about 13% in the last three months, yet its quarterly results surpassed expectations, and analysts maintain an overweight rating with a projected 15% upside, reflecting confidence in its future performance.
Fool
8.0
05-26Fool
Four High-Yield Dividend Stocks Recommended
  • Coca-Cola's Stability: Coca-Cola (KO) raised its quarterly dividend from $0.51 to $0.53 this year, marking 64 consecutive years of increases, which underscores its status as a 'Dividend King'; the current yield stands at 2.6%, significantly above the S&P 500's 1.1%.
  • PepsiCo's Growth: PepsiCo (PEP) announced a 4% increase in its quarterly dividend to $1.48 this month, having raised dividends for 54 consecutive years, with a current yield of 4%, nearly four times that of the S&P 500, reflecting its strong profitability and market competitiveness.
  • Procter & Gamble's Long-Term Commitment: Procter & Gamble (PG) has paid dividends since 1890 and has raised them for 70 straight years, with the latest quarterly payout increased by 3% to $1.0885, yielding 3.1%, supported by over $11 billion in free cash flow that easily covers $7.6 billion in dividends.
  • Realty Income's Appeal: Realty Income (O), a REIT, pays monthly dividends and recently raised its payout from $0.27 to $0.2705, yielding 5.2%, well above the FTSE Nareit All Equity REITs Index's 3.7%, demonstrating its strong cash flow and distribution capacity.
Wall Street analysts forecast KO stock price to rise
14 Analyst Rating
Wall Street analysts forecast KO stock price to rise
13 Buy
1 Hold
0 Sell
Strong Buy
Current: 0.000
sliders
Low
71.00
Averages
79.33
High
85.00
Current: 0.000
sliders
Low
71.00
Averages
79.33
High
85.00
Citi
Filippo Falorni
Buy
maintain
$90 -> $91
AI Analysis
2026-05-18
Reason
Citi
Filippo Falorni
Price Target
$90 -> $91
AI Analysis
2026-05-18
maintain
Buy
Reason
Citi analyst Filippo Falorni raised the firm's price target on Coca-Cola to $91 from $90 and keeps a Buy rating on the shares. Citi sees volume benefits for Coke from this summer's World Cup. Coca-Cola is an official tournament partner that is executing its largest-ever marketing campaign for the games, the analyst tells investors in a research note.
Barclays
Overweight
maintain
$83 -> $85
2026-04-30
Reason
Barclays
Price Target
$83 -> $85
2026-04-30
maintain
Overweight
Reason
Barclays raised the firm's price target on Coca-Cola to $85 from $83 and keeps an Overweight rating on the shares. The company's Q1 offered the first evidence of a return to more meaningfully balanced growth, the analyst tells investors in a research note.
Unlock Full Analyst Thesis, Get the complete breakdown of rating reason for KO
Unlock Now

Valuation Metrics

The current forward P/E ratio for Coca-Cola Co (KO.N) is 25.06, compared to its 5-year average forward P/E of 22.98. For a more detailed relative valuation and DCF analysis to assess Coca-Cola Co's fair value, Click here.

Forward PE

The forward P/E ratio is a valuation metric that divides a company's current stock price by its estimated future earnings per share over the next 12 months.
StronglyUndervaluedUndervaluedFairOvervaluedStronglyOvervalueddotted line Image
5Y Average PE
22.98
Current PE
25.06
Overvalued PE
24.63
Undervalued PE
21.34

Forward EV/EBITDA

The forward EV/EBITDA ratio is a valuation metric that divides a company's enterprise value (EV) by its estimated future earnings before interest, taxes, depreciation, and amortization (EBITDA) over the next 12 months.
StronglyUndervaluedUndervaluedFairOvervaluedStronglyOvervalueddotted line Image
5Y Average EV/EBITDA
20.25
Current EV/EBITDA
20.68
Overvalued EV/EBITDA
21.79
Undervalued EV/EBITDA
18.70

Forward PS

The forward P/S ratio is a valuation metric that divides a company's current stock price by its estimated future sales (or revenue) per share over the next 12 months.
StronglyUndervaluedUndervaluedFairOvervaluedStronglyOvervalueddotted line Image
5Y Average PS
6.04
Current PS
7.02
Overvalued PS
6.43
Undervalued PS
5.66

Financials

AI Analysis
Annual
Quarterly

Related Community Screener

what stocks are the best to buy in June
Intellectia · 95 candidates
Market Cap: >= 10.00BVolume: >= 2,000,000Analyst Consensus: Strong BuyList Exchange: XNYS, XNAS, XASEMoving Average Relationship: PriceAboveMA20, PriceAboveMA200Month Price Change Pct: >= $0.00
Ticker
Name
Market Cap$
top bottom
NVDA logo
NVDA
NVIDIA Corp
5.14T
GOOG logo
GOOG
Alphabet Inc
4.66T
MSFT logo
MSFT
Microsoft Corp
3.07T
AMZN logo
AMZN
Amazon.com Inc
2.92T
TSM logo
TSM
Taiwan Semiconductor Manufacturing Co Ltd
2.19T
AVGO logo
AVGO
Broadcom Inc
2.00T
10 strong buy stocks
Intellectia · 59 candidates
Region: USAnalyst Consensus: Strong BuyRelative Vol: >= 1.50Moving Average Relationship: PriceAboveMA20Is Index Component: GSPC
Ticker
Name
Market Cap$
top bottom
NVDA logo
NVDA
NVIDIA Corp
5.41T
GOOG logo
GOOG
Alphabet Inc
4.66T
MSFT logo
MSFT
Microsoft Corp
3.13T
AMZN logo
AMZN
Amazon.com Inc
2.85T
LLY logo
LLY
Eli Lilly and Co
959.51B
MU logo
MU
Micron Technology Inc
825.49B
stocks up in a down market
Intellectia · 87 candidates
Relative Vol: >= 1.50Moving Average Relationship: PriceAboveMA20, PriceAboveMA200Week Price Change Pct: >= $0.00Month Price Change Pct: >= $0.00Is Index Component: GSPCEma 20: >= 0Macd: bullish
Ticker
Name
Market Cap$
top bottom
AAPL logo
AAPL
Apple Inc
4.39T
WMT logo
WMT
Walmart Inc
1.07T
XOM logo
XOM
Exxon Mobil Corp
673.76B
V logo
V
Visa Inc
625.00B
COST logo
COST
Costco Wholesale Corp
485.50B
CSCO logo
CSCO
Cisco Systems Inc
455.74B
which megacap surged max yesterday
Intellectia · 64 candidates
Region: USMarket Cap Category: mega
Ticker
Name
Market Cap$
top bottom
UNH logo
UNH
UnitedHealth Group Inc
359.98B
PM logo
PM
Philip Morris International Inc
291.34B
NFLX logo
NFLX
Netflix Inc
369.12B
ABBV logo
ABBV
AbbVie Inc
367.25B
LLY logo
LLY
Eli Lilly and Co
932.20B
COST logo
COST
Costco Wholesale Corp
453.36B
best stock to buy now
Intellectia · 43 candidates
Market Cap: >= 20.00BRegion: USVolume: >= 2,000,000Analyst Consensus: Strong BuyQuarter Eps Yoy Growth: >= 15.0%List Exchange: XNYS, XNAS, XASEReturn On Equity: >= 15.0%Moving Average Relationship: PriceAboveMA20, PriceAboveMA200
Ticker
Name
Market Cap$
top bottom
GOOG logo
GOOG
Alphabet Inc
4.79T
AMZN logo
AMZN
Amazon.com Inc
2.92T
TSM logo
TSM
Taiwan Semiconductor Manufacturing Co Ltd
2.15T
AVGO logo
AVGO
Broadcom Inc
1.95T
LLY logo
LLY
Eli Lilly and Co
918.16B
MU logo
MU
Micron Technology Inc
729.23B
Stocks bullish for a year
Intellectia · 58 candidates
Market Cap: >= 20.00BPrice: >= $-100.00Rsi Category: moderateMoving Average Relationship: PriceAboveMA200, PriceAboveMA20Year Price Change Pct: >= $0.00Is Index Component: GSPC, NDXEma 20: >= -100Ema 60: >= -100Ema 200: >= -100Macd: bullish
Ticker
Name
Market Cap$
top bottom
AAPL logo
AAPL
Apple Inc
4.17T
TSLA logo
TSLA
Tesla Inc
1.46T
WMT logo
WMT
Walmart Inc
1.04T
LLY logo
LLY
Eli Lilly and Co
931.26B
ASML logo
ASML
ASML Holding NV
556.13B
ORCL logo
ORCL
Oracle Corp
533.08B
today's stock picks
Intellectia · 74 candidates
Volume: >= 1,000,000Price Change Pct: $1.00 - $10.00List Exchange: XNYS, XNASMoving Average Relationship: PriceAboveMA20Is Index Component: GSPC, NDX
Ticker
Name
Market Cap$
top bottom
KO logo
KO
Coca-Cola Co
329.83B
NUE logo
NUE
Nucor Corp
48.80B
MOH logo
MOH
Molina Healthcare Inc
9.17B
BEN logo
BEN
Franklin Resources Inc
14.12B
UDR logo
UDR
UDR Inc
11.42B
AVB logo
AVB
AvalonBay Communities Inc
23.98B
Featured Screeners
Intellectia · 85 candidates
Market Cap: >= 30.00BList Exchange: XNYS, XNAS, XASEReturn On Equity: >= 15.0%Moving Average Relationship: PriceAboveMA200Is Index Component: GSPCMonthly Average Dollar Volume: >= 3,000,000
Ticker
Name
Market Cap$
top bottom
NVDA logo
NVDA
NVIDIA Corp
5.06T
GOOG logo
GOOG
Alphabet Inc
4.14T
AAPL logo
AAPL
Apple Inc
3.98T
AMZN logo
AMZN
Amazon.com Inc
2.84T
AVGO logo
AVGO
Broadcom Inc
2.00T
WMT logo
WMT
Walmart Inc
1.04T
yes stocks
Intellectia · 27 candidates
Market Cap: >= 50.00BDividend Yield Ttm: 2.50 - 6Analyst Consensus: Strong Buy, Moderate BuyBeta: LowRiskRevenue 5yr Cagr: >= 7
Ticker
Name
Market Cap$
top bottom
XOM logo
XOM
Exxon Mobil Corp
618.95B
CVX logo
CVX
Chevron Corp
368.92B
KO logo
KO
Coca-Cola Co
329.83B
UNH logo
UNH
UnitedHealth Group Inc
322.34B
MRK logo
MRK
Merck & Co Inc
276.38B
PM logo
PM
Philip Morris International Inc
255.91B
best left to buy now
Intellectia · 85 candidates
Analyst Consensus: Strong Buy, Moderate BuyEps 5yr Cagr: >= 5Pe Ttm: 8 - 35Moving Average Relationship: PriceAboveMA200Is Index Component: GSPC, NDX
Ticker
Name
Market Cap$
top bottom
GOOG logo
GOOG
Alphabet Inc
4.14T
AAPL logo
AAPL
Apple Inc
3.98T
JPM logo
JPM
JPMorgan Chase & Co
826.87B
MU logo
MU
Micron Technology Inc
560.17B
JNJ logo
JNJ
Johnson & Johnson
547.64B
BAC logo
BAC
Bank of America Corp
371.11B

Whales Holding KO

R
Rakuten Investment Management, Inc.
Holding
KO
+32.67%
3M Return
B
Blue Sparrow, Llc
Holding
KO
+22.62%
3M Return
I
Invesco Capital Management LLC
Holding
KO
+22.54%
3M Return
B
BNP Paribas SA
Holding
KO
+22.46%
3M Return
K
Keskinäinen vakuutusyhtiö Eläke-Fennia
Holding
KO
+21.20%
3M Return
K
Keskinäinen työeläkevakuutusyhtiö Varma
Holding
KO
+20.92%
3M Return

Trading Trends

    Insider
    Hedge Fund
    Congress Trading

People Also Watch

Frequently Asked Questions

What is Coca-Cola Co (KO) stock price today?

The current price of KO is 79.79 USD — it has decreased -0.77

What is Coca-Cola Co (KO)'s business?

The Coca-Cola Company is a beverage company. The Company's segments include Europe, Middle East and Africa (EMEA); Latin America; North America; Asia Pacific, and Bottling Investments. It sells multiple brands across several beverage categories worldwide. Its portfolio of sparkling soft drink brands includes Coca-Cola, Sprite and Fanta. Its water, sports, coffee and tea brands include Dasani, smartwater, vitaminwater, Topo Chico, BODYARMOR, Powerade, Costa, Georgia, Fuze Tea, Gold Peak and Ayataka. Its juice, value-added dairy and plant-based beverage brands include Minute Maid, Simply, innocent, Del Valle, fairlife and Santa Clara. It operates in two lines of business: concentrate operations and finished product operations. Its concentrate operations sell beverage concentrates, syrups, including fountain syrups, and certain finished beverages to authorized bottling operations. Its finished product operations sell sparkling soft drinks and a variety of other finished beverages.

What is the price predicton of KO Stock?

Wall Street analysts forecast KO stock price to rise over the next 12 months. According to Wall Street analysts, the average 1-year price target for KO is79.33 USD with a low forecast of 71.00 USD and a high forecast of 85.00 USD. However, analyst price targets are subjective and often lag stock prices, so investors should focus on the objective reasons behind analyst rating changes, which better reflect the company's fundamentals.

What is Coca-Cola Co (KO)'s revenue for the last quarter?

Coca-Cola Co revenue for the last quarter amounts to 12.47B USD, increased 12.07

What is Coca-Cola Co (KO)'s earnings per share (EPS) for the last quarter?

Coca-Cola Co. EPS for the last quarter amounts to 0.91 USD, increased 18.18

How many employees does Coca-Cola Co (KO). have?

Coca-Cola Co (KO) has 65900 emplpoyees as of May 29 2026.

What is Coca-Cola Co (KO) market cap?

Today KO has the market capitalization of 351.17B USD.