DKS Overview
-
$
0.000
0.000(0.000%)
At close0.000(0.000%)Aft-market
ET
Loading chart...

The current price of DKS is 236.18 USD — it has increased 2.79
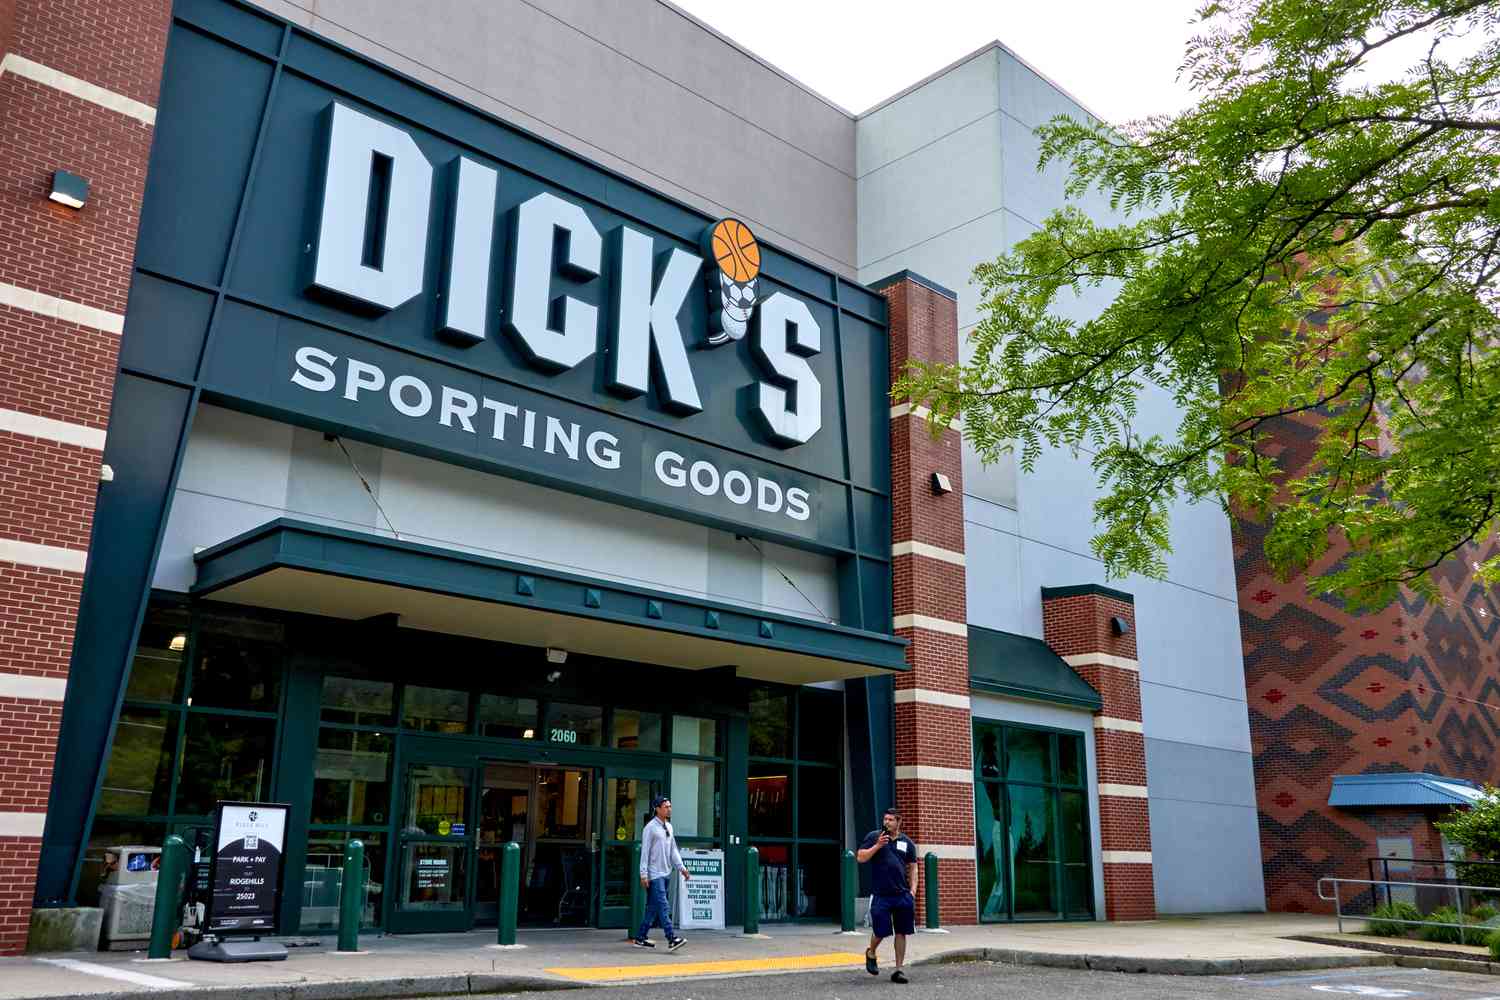
DICK'S Sporting Goods, Inc. is an omni-channel sporting goods retailer. The Company owns and operates Golf Galaxy, Public Lands, and Going Going Gone! specialty concept stores, and also offers its products online and through its mobile applications. It also owns and operates DICK’S House of Sport and Golf Galaxy Performance Center, as well as GameChanger, a youth sports mobile platform for livestreaming, scheduling, communications and scorekeeping. The Company operates over 3,200 stores e-commerce and digital businesses across 20 countries in North America, Europe, Asia, and Australia, plus a licensed store presence in Europe, the Middle East and Asia. It carries a wide variety of national brands, including but not limited to adidas, Asics, Brooks, Callaway Golf, Carhartt, Columbia, Hoka, Jordan, New Balance, Nike, Peloton, The North Face, Under Armour, Wilson, Yeti, and others. It also owns and operates brands such as Foot Locker, Kids Foot Locker, Champs Sports, WSS, and atmos.
Wall Street analysts forecast DKS stock price to rise over the next 12 months. According to Wall Street analysts, the average 1-year price target for DKS is248.14 USD with a low forecast of 180.00 USD and a high forecast of 285.00 USD. However, analyst price targets are subjective and often lag stock prices, so investors should focus on the objective reasons behind analyst rating changes, which better reflect the company's fundamentals.
Dick's Sporting Goods Inc revenue for the last quarter amounts to 5.17B USD, increased 62.68
Dick's Sporting Goods Inc. EPS for the last quarter amounts to 3.54 USD, increased 9.26
Dick's Sporting Goods Inc (DKS) has 31600 emplpoyees as of July 05 2026.
Today DKS has the market capitalization of 21.14B USD.