Intellectia LogoIntellectia
Product
Resources
Markets
News
Partner Program
Pricing
Log inTry for Free
Intellectia Logo
Log in
Intellectia Logo

Product

Features
Financial AI Agent
Stock Technical Analysis
Stock Monitor
Hedge Fund Tracker
AI Screener
Trading Strategies
AI Stock Picker
Swing Trading
Quant AI
Stock Chart Patterns
Daytrading Center
AI Earnings Prediction
Whales Auto Tracker
Backtesting Playground

Resources

Learn
Blog
Earnings
Tutorial
Help Center
Company
About Us
Contact
Press
Reward Program
Partner Program
Tools
Dividend Calculator
Dividend Yield Calculator
Options Profit Calculator
Compare
TradingView
SeekingAlpha

Markets

Trending Stocks
Hot Crypto
Trending News
All Stocks

News

Trading News
Overview
Top News
Daily Market Brief
Earnings
Latest
Newswire
Stock News
Crypto News
Monitor News
Partner ProgramPricing
Start for Free
  1. Home
  2. >
  3. Stock
  4. >
  5. CAG
stocks logo

CAG

-
collectAdd to Watchlistadvanced chartAdvanced Chart
$
0.000
0(0.000%)1D
collectadvanced chart
    Overview
    Forecast
    Valuation
    Earnings
High
--
Open
--
VWAP
--
Vol
--
Mkt Cap
--
Low
--
Amount
--
EV/EBITDA(TTM)
--
Total Shares
--
EV
--
EV/OCF(TTM)
--
P/S(TTM)
--
Intellectia AI SwingMax

Market Estimates

Earnings Estimates
Earnings Estimates
Revenue
YoY Chg
EPS
YoYChg
FY2026Q2
FY2026Q3
FY2026Q4
3.20B
0%
0.720
+2.86%
2.89B
+1.58%
0.560
+9.8%
2.92B
+5.01%
0.650
+16.07%
Estimates Revision
The market is revising Downward the revenue expectations for Conagra Brands, Inc. (CAG) for FY2026, with the revenue forecasts being adjusted by -0.58% over the past three months. During the same period, the stock price has changed by -12.09%.
Revenue Estimates for FY2026
Revise Downward
down Image
-0.58%
In Past 3 Month
EPS Estimates for FY2026
No Change
down Image
0.00%
In Past 3 Month
Stock Price
Go Down
down Image
-12.09%
In Past 3 Month
Wall Street analysts forecast CAG stock price to rise over the next 12 months. According to Wall Street analysts, the average 1-year price target for CAG is 20.33 USD with a low forecast of 18.00 USD and a high forecast of 23.00 USD. However, analyst price targets are subjective and often lag stock prices, so investors should focus on the objective reasons behind analyst rating changes, which better reflect the company's fundamentals.
12 Analyst Rating
Wall Street analysts forecast CAG stock price to rise over the next 12 months. According to Wall Street analysts, the average 1-year price target for CAG is 20.33 USD with a low forecast of 18.00 USD and a high forecast of 23.00 USD. However, analyst price targets are subjective and often lag stock prices, so investors should focus on the objective reasons behind analyst rating changes, which better reflect the company's fundamentals.
1 Buy
10 Hold
1 Sell
Hold
Current: 16.950
sliders
Low
18.00
Averages
20.33
High
23.00
Current: 16.950
sliders
Low
18.00
Averages
20.33
High
23.00
Goldman Sachs
Sell
downgrade
$18 -> $16
2025-11-25
Reason
Goldman Sachs
Price Target
$18 -> $16
2025-11-25
downgrade
Sell
Reason
Goldman Sachs lowered the firm's price target on Conagra Brands to $16 from $18 and keeps a Sell rating on the shares.
Morgan Stanley
Equal Weight
maintain
$20 -> $21
2025-09-24
Reason
Morgan Stanley
Price Target
$20 -> $21
2025-09-24
maintain
Equal Weight
Reason
Morgan Stanley raised the firm's price target on Conagra Brands to $21 from $20 and keeps an Equal Weight rating on the shares. The firm, which expects Conagra to report Q1 results broadly in line with expectations and to reiterate FY26 guidance, sees potential risk to Q2 consensus given sticky protein costs and softer quarter-to-date scanner trends, the analyst tells investors in a preview.
Evercore ISI
In Line
downgrade
$24 -> $23
2025-09-24
Reason
Evercore ISI
Price Target
$24 -> $23
2025-09-24
downgrade
In Line
Reason
Evercore ISI lowered the firm's price target on Conagra Brands to $23 from $24 and keeps an In Line rating on the shares. While there are pockets of strength, Conagra faces another challenging year with FY26 projected as a transition period with headwinds from rising commodity costs, particularly beef, and higher tariffs, the analyst tells investors in an earnings preview.
JPMorgan
Neutral
initiated
$25 -> $20
2025-08-20
Reason
JPMorgan
Price Target
$25 -> $20
2025-08-20
initiated
Neutral
Reason
JPMorgan assumed coverage of Conagra Brands with a Neutral rating and price target of $20, down from $25. The firm assumed coverage of 24 stocks in the food producers, food retail, and agricultural products sectors. JPMorgan's top picks are McCormick (MKC), Albertsons (ACI), Hormel Foods (HRL), and J.M. Smucker (SJM), and it is most cautious on Beyond Meat (BYND) and General Mills (GIS). Food producers are dealing with pressure from slower center store category growth and market share losses while food retailers should benefit from the continued inflationary environment, the analyst tells investors in a research note. The firm adds that while agricultural products companies could be past the worst of their earnings pressures, an earnings recovery hinges on U.S. biofuels regulations that are proposed but not finalized.
BofA
Underperform
downgrade
$20 -> $18
2025-07-11
Reason
BofA
Price Target
$20 -> $18
2025-07-11
downgrade
Underperform
Reason
BofA lowered the firm's price target on Conagra Brands to $18 from $20 and keeps an Underperform rating on the shares. Conagra provided an initial FY26 financial outlook that was well below Street estimates, the analyst tells investors in a research note.
Bernstein
Alexia Howard
Market Perform
downgrade
$25 -> $21
2025-07-11
Reason
Bernstein
Alexia Howard
Price Target
$25 -> $21
2025-07-11
downgrade
Market Perform
Reason
Bernstein analyst Alexia Howard lowered the firm's price target on Conagra Brands to $21 from $25 and keeps a Market Perform rating on the shares. The firm notes that Conagra's leadership team is doubling down on returning to volume growth as a priority for FY26 and as a result is reinvesting in levers to achieve this, which has led to guidance on EPS that is 23% below consensus estimates. Understandably some of these are also tariffs and protein/labor inflation, stranded costs from recent divestments, the need to upgrade the supply chain given recent mishaps in frozen chicken and vegetables, rebased incentive comp and adverse FX. But Bernstein says it can't help but also believe that demand curves are shifting in ways that are going to require winning trust back among lapsed consumers.
See All Ratings

Valuation Metrics

The current forward P/E ratio for Conagra Brands Inc (CAG.N) is 9.67, compared to its 5-year average forward P/E of 12.25. For a more detailed relative valuation and DCF analysis to assess Conagra Brands Inc 's fair value, click here.
  • Forward PE
  • Forward EV/EBITDA
  • Forward PS

Forward PE

The forward P/E ratio is a valuation metric that divides a company's current stock price by its estimated future earnings per share over the next 12 months.
StronglyUndervaluedUndervaluedFairOvervaluedStronglyOvervalueddotted line Image
Undervalued
5Y Average PE
12.25
Current PE
9.67
Overvalued PE
14.06
Undervalued PE
10.44

Forward EV/EBITDA

The forward EV/EBITDA ratio is a valuation metric that divides a company's enterprise value (EV) by its estimated future earnings before interest, taxes, depreciation, and amortization (EBITDA) over the next 12 months.
StronglyUndervaluedUndervaluedFairOvervaluedStronglyOvervalueddotted line Image
N/A
5Y Average EV/EBITDA
10.66
Current EV/EBITDA
0.00
Overvalued EV/EBITDA
11.63
Undervalued EV/EBITDA
9.69

Forward PS

The forward P/S ratio is a valuation metric that divides a company's current stock price by its estimated future sales (or revenue) per share over the next 12 months.
StronglyUndervaluedUndervaluedFairOvervaluedStronglyOvervalueddotted line Image
N/A
5Y Average PS
1.26
Current PS
0.00
Overvalued PS
1.49
Undervalued PS
1.03
Financial AI Agent
Financial AI Agent

Financials

Annual
Quarterly
N/A
Total Revenue
N/A
Operating Profit
N/A
Net Income after Tax
N/A
EPS - Diluted
N/A
Free Cash Flow
N/A
Gross Profit Margin - %
N/A
FCF Margin - %
N/A
Net Margin - %
N/A
ROIC

Trading Trends

  • Insider
  • Hedge Fund
  • Congress Trading
Insider
Insiders are Neutral. There are no significant trading trends over the last month.
Sold
Bought
Hedge Fund
Hedge Funds are Neutral. There are no significant trading trends over the last quarter.
Sold
Bought
Congress Trading
Congress are Neutral. There are no significant trading trends over the last month.
Sold
Bought
Insider
Insiders are Neutral. There are no significant trading trends over the last month.
Sold
Bought
AI Stock Picker
AI Stock Picker

CAG News & Events

Events Timeline

(ET)
2025-11-17
12:24:37
Video: Meet the Wall Street-Approved Winners from Food Tariff Relief
select
link
2025-11-17
07:32:04
JPMorgan identifies three key winners from lowered agricultural tariffs.
select
2025-10-20 (ET)
2025-10-20
08:03:06
Valmont appoints William Johnson as Chief Accounting Officer
select
Sign Up For More Events

News

[object Object]
Preview
4.5
12-03NASDAQ.COM
Stocks Close Up Driven by Gains in Chip Manufacturers and Boeing
  • Market Performance: The S&P 500, Dow Jones, and Nasdaq 100 all closed higher, with the Nasdaq reaching a 2.5-week high, driven by strong earnings in the tech sector, particularly from MongoDB and Boeing.

  • OECD Economic Forecast: The OECD maintained its global GDP forecast for 2025 at +3.2% but raised the US forecast to +2.0%, citing resilience against trade tariffs and strong investment in AI.

  • Upcoming Economic Data: Key US economic indicators are set to be released this week, including employment changes, manufacturing production, and personal spending, with markets anticipating a high probability of a rate cut at the next FOMC meeting.

  • Corporate Earnings Highlights: Q3 earnings season showed strong results, with 83% of S&P 500 companies exceeding forecasts, and notable stock movements included significant gains for semiconductor companies and MongoDB, while some defensive stocks declined.

[object Object]
Preview
8.0
12-03NASDAQ.COM
Conagra Brands (CAG) Stock Exceeds 8% Yield Threshold
  • Dividend Predictability: Dividend amounts are generally unpredictable and fluctuate with a company's profitability.

  • Conagra Brands Inc: Analyzing Conagra's historical dividend chart can provide insights into the likelihood of maintaining an 8% annual yield.

  • Investment Opportunities: There are additional dividend stocks currently available at discounted prices.

  • Author's Perspective: The opinions expressed in the article are those of the author and do not necessarily represent Nasdaq, Inc.

[object Object]
Preview
4.0
11-28WSJ
Frugal Americans Push the Boundaries of Leftover Usage
  • Leftover Olympics: A trend has emerged where leftover food items, previously discarded, are now being creatively repurposed into meals due to rising grocery costs.

  • Fridge Foraging: Americans are increasingly utilizing uneaten food, such as hot dogs and half-empty cans, as main ingredients in their cooking to combat inflation.

Sign Up For More News

People Also Watch

FAQ

arrow icon

What is Conagra Brands Inc (CAG) stock price today?

The current price of CAG is 16.95 USD — it has decreased -1.22 % in the last trading day.

arrow icon

What is Conagra Brands Inc (CAG)'s business?

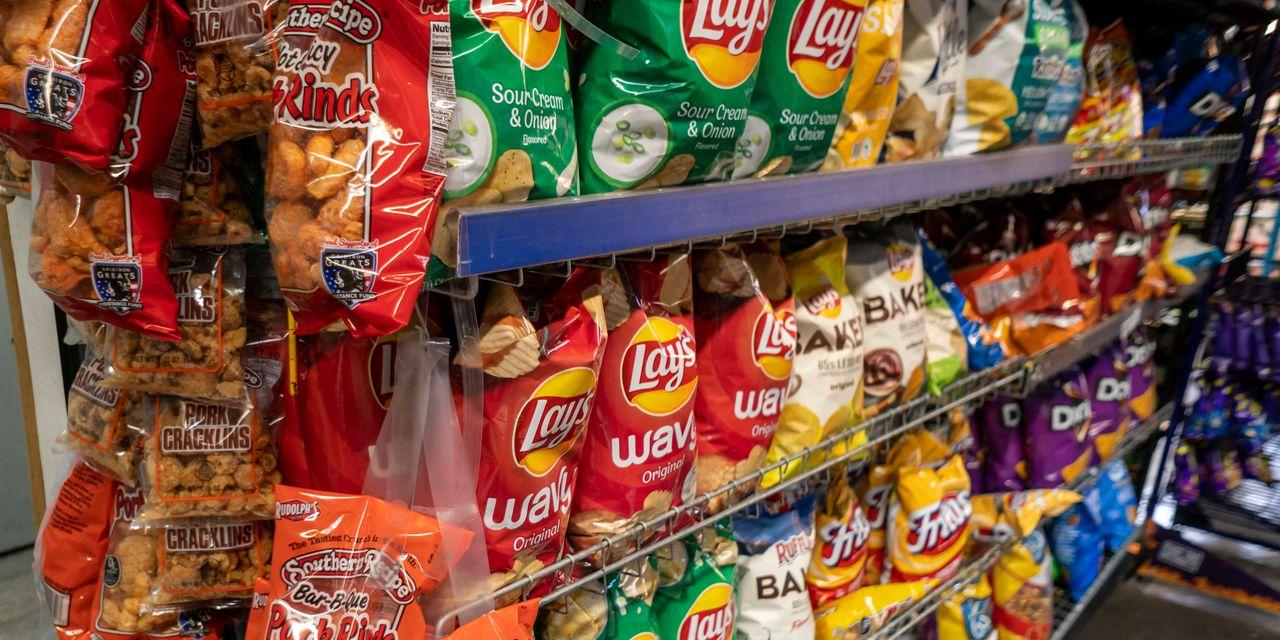
Conagra Brands, Inc. is a branded food company. The Company’s segments include Grocery & Snacks, Refrigerated & Frozen, International, and Foodservice. The Grocery & Snacks segment includes branded, shelf-stable food products sold in various retail channels in the United States. The Refrigerated & Frozen segment includes branded, temperature-controlled food products sold in various retail channels in the United States. The International segment includes branded food products in various temperature states, sold in various retail and foodservice channels outside the United States. The Foodservice segment includes branded and customized food products, including meals, entrees, sauces, and a variety of custom-manufactured culinary products that are packaged for sale to restaurants and other foodservice establishments primarily in the United States. Its brands include Birds Eye, Duncan Hines, Healthy Choice, Marie Callender's, Reddi-wip, Slim Jim, and Angie's BOOMCHICKAPOP.

arrow icon

What is the price predicton of CAG Stock?

Wall Street analysts forecast CAG stock price to rise over the next 12 months. According to Wall Street analysts, the average 1-year price target for CAG is 20.33 USD with a low forecast of 18.00 USD and a high forecast of 23.00 USD. However, analyst price targets are subjective and often lag stock prices, so investors should focus on the objective reasons behind analyst rating changes, which better reflect the company's fundamentals.

arrow icon

What is Conagra Brands Inc (CAG)'s revenue for the last quarter?

Conagra Brands Inc revenue for the last quarter amounts to 2.63B USD, decreased -5.81 % YoY.

arrow icon

What is Conagra Brands Inc (CAG)'s earnings per share (EPS) for the last quarter?

Conagra Brands Inc. EPS for the last quarter amounts to 0.34 USD, decreased -64.95 % YoY.

arrow icon

What changes have occurred in the market's expectations for Conagra Brands Inc (CAG)'s fundamentals?

The market is revising Downward the revenue expectations for Conagra Brands, Inc. (CAG) for FY2026, with the revenue forecasts being adjusted by -0.58% over the past three months. During the same period, the stock price has changed by -12.09%.
arrow icon

How many employees does Conagra Brands Inc (CAG). have?

Conagra Brands Inc (CAG) has 18300 emplpoyees as of December 05 2025.

arrow icon

What is Conagra Brands Inc (CAG) market cap?

Today CAG has the market capitalization of 8.11B USD.

Intellectia LogoIntellectiaIntellectia LogoIntellectia

Redefine Your Investment Decisions

TwitterTwitterYoutubeYoutubeQuoraQuoraDiscordDiscordLinkedinLinkedinTelegramTelegram
AppStoreGooglePlay

Copyright © 2025 Intellectia.AI. All Rights Reserved.

pci certified logo
Company
HomeContactAbout UsNews Release
Compare
TradingViewSeeking Alpha
Features
Financial AI AgentStock Technical AnalysisStock MonitorHedge Fund TrackerAI ScreenerDaytrading Center
Strategies
AI Stock PickerSwing TradingStock Chart PatternsEarnings TradingDaytrading CenterAI Earnings PredictionQuant AIWhales Auto TrackerBacktesting Playground
Free Tools
Dividend CalculatorDividend Yield CalculatorOptions Profit Calculator
Resource
BlogTutorialEarningsTrending StocksCrypto MarketPartner ProgramTerms of UsePrivacy PolicySecuritySitemap
Start for Free