EXEL Overview
-
$
0.000
0.000(0.000%)
At close0.000(0.000%)Aft-market
ET
Loading chart...

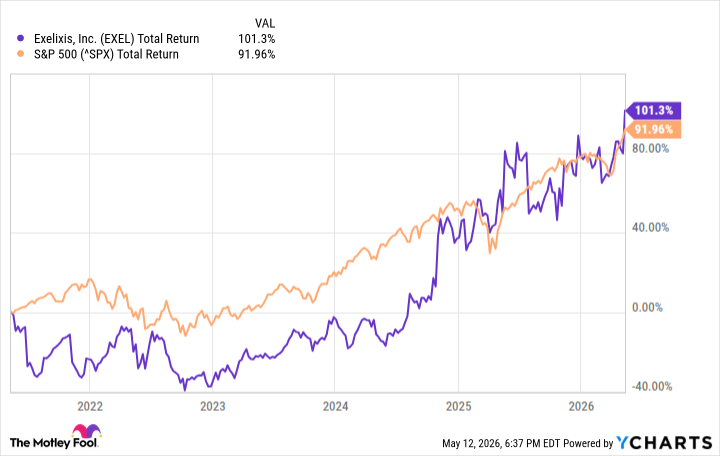
The current price of EXEL is 51.91 USD — it has decreased -1.01
Exelixis, Inc. is an oncology company. The Company has produced four marketed pharmaceutical products, two of which are formulations of its flagship molecule, cabozantinib. It is also advancing and evolving its product pipeline portfolio, including its lead investigational asset, zanzalintinib. Cabozantinib is an inhibitor of multiple tyrosine kinases, including MET, AXL, VEGF receptors and RET and has been also approved as CABOMETYX tablets for advanced renal cell carcinoma, for previously treated hepatocellular carcinoma and for previously treated, radioactive iodine-refractory differentiated thyroid cancer, and as COMETRIQ capsules for progressive, metastatic medullary thyroid cancer. The Company's other two products are COTELLIC, an inhibitor of MEK approved as part of multiple combination regimens to treat specific forms of advanced melanoma and MINNEBRO an oral, non-steroidal, selective blocker of the mineralocorticoid receptor approved the treatment of hypertension in Japan.
Wall Street analysts forecast EXEL stock price to rise over the next 12 months. According to Wall Street analysts, the average 1-year price target for EXEL is44.09 USD with a low forecast of 30.00 USD and a high forecast of 52.00 USD. However, analyst price targets are subjective and often lag stock prices, so investors should focus on the objective reasons behind analyst rating changes, which better reflect the company's fundamentals.
Exelixis Inc revenue for the last quarter amounts to 610.81M USD, increased 9.97
Exelixis Inc. EPS for the last quarter amounts to 0.79 USD, increased 43.64
Exelixis Inc (EXEL) has 1077 emplpoyees as of June 20 2026.
Today EXEL has the market capitalization of 13.05B USD.