CPB Overview
-
$
0.000
0.000(0.000%)
At close0.000(0.000%)Aft-market
ET
Loading chart...

The current price of CPB is 21.15 USD — it has increased 0.19
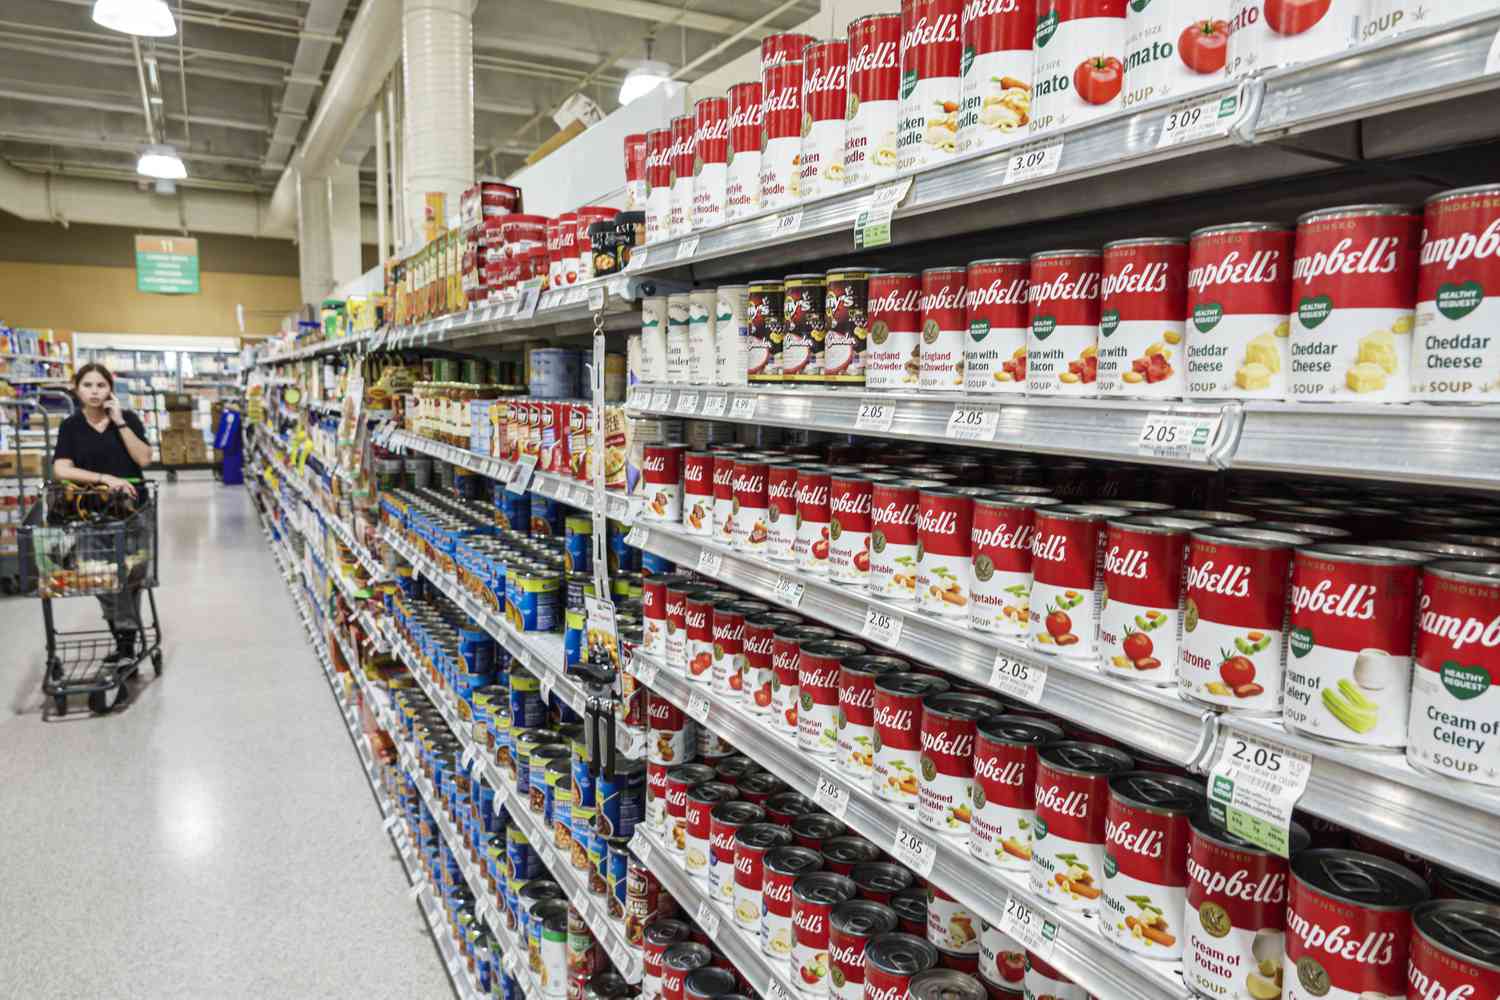
The Campbell's Company provides affordable food and beverages. The Company is focused on brand powerhouse, across two divisions: Meals & Beverages and Snacks. The Company's portfolio of approximately 16 brands includes Campbell's, Cape Cod, Chunky, Goldfish, Kettle Brand, Lance, Late July, Pace, Pacific Foods, Pepperidge Farm, Prego, Rao's, Snack Factory pretzel crisps, Snyder's of Hanover, Swanson and V8. It offers nutritious, convenient food for Canadian families. Its North American Foodservice division offers food, recipes, and tailored solutions for a range of segments, including healthcare facilities, restaurants and specialty coffee shops, schools, vending and micro-markets, and lodging throughout North America. Pacific Foods is a producer of organic broth and soup offering a range of organic and plant-based options, soups include Creamy Roasted Red Pepper & Tomato and new ready-to-serve canned soups.
Wall Street analysts forecast CPB stock price to rise over the next 12 months. According to Wall Street analysts, the average 1-year price target for CPB is31.07 USD with a low forecast of 27.00 USD and a high forecast of 38.00 USD. However, analyst price targets are subjective and often lag stock prices, so investors should focus on the objective reasons behind analyst rating changes, which better reflect the company's fundamentals.
Campbell's Co revenue for the last quarter amounts to 2.37B USD, decreased -4.40
Campbell's Co. EPS for the last quarter amounts to 0.41 USD, increased 86.36
Campbell's Co (CPB) has 13700 emplpoyees as of June 21 2026.
Today CPB has the market capitalization of 6.31B USD.