Intellectia LogoIntellectia
Product
Resources
Markets
News
Partner Program
Pricing
Log inTry for Free
Intellectia Logo
Log in
Intellectia Logo

Product

Features
Financial AI Agent
Stock Technical Analysis
Stock Monitor
Hedge Fund Tracker
AI Screener
Trading Strategies
AI Stock Picker
Swing Trading
Quant AI
Stock Chart Patterns
Daytrading Center
AI Earnings Prediction
Whales Auto Tracker
Backtesting Playground

Resources

Learn
Blog
Earnings
Tutorial
Help Center
Company
About Us
Contact
Press
Reward Program
Partner Program
Tools
Dividend Calculator
Dividend Yield Calculator
Options Profit Calculator
Compare
TradingView
SeekingAlpha

Markets

Trending Stocks
Hot Crypto
Trending News
All Stocks

News

Trading News
Overview
Top News
Daily Market Brief
Earnings
Latest
Newswire
Stock News
Crypto News
Monitor News
Partner ProgramPricing
Start for Free
  1. Home
  2. >
  3. Stock
  4. >
  5. SJM
stocks logo

SJM

-
collectAdd to Watchlistadvanced chartAdvanced Chart
$
0.000
0(0.000%)1D
collectadvanced chart
    Overview
    Forecast
    Valuation
    Earnings
High
--
Open
--
VWAP
--
Vol
--
Mkt Cap
--
Low
--
Amount
--
EV/EBITDA(TTM)
--
Total Shares
--
EV
--
EV/OCF(TTM)
--
P/S(TTM)
--
Financial AI Agent
Financial AI Agent

Market Estimates

Earnings Estimates
Earnings Estimates
Revenue
YoY Chg
EPS
YoYChg
FY2026Q3
FY2026Q4
FY2027Q1
2.31B
+5.89%
2.255
-13.59%
2.31B
+7.76%
2.728
+18.12%
2.21B
+4.4%
2.233
+17.51%
Estimates Revision
The market is revising Upward the revenue expectations for The J. M. Smucker Company (SJM) for FY2026, with the revenue forecasts being adjusted by 0.05% over the past three months. During the same period, the stock price has changed by -11.47%.
Revenue Estimates for FY2026
Revise Upward
up Image
+0.05%
In Past 3 Month
EPS Estimates for FY2026
Revise Upward
up Image
+0.09%
In Past 3 Month
Stock Price
Go Down
down Image
-11.47%
In Past 3 Month
Wall Street analysts forecast SJM stock price to rise over the next 12 months. According to Wall Street analysts, the average 1-year price target for SJM is 119.00 USD with a low forecast of 105.00 USD and a high forecast of 130.00 USD. However, analyst price targets are subjective and often lag stock prices, so investors should focus on the objective reasons behind analyst rating changes, which better reflect the company's fundamentals.
14 Analyst Rating
Wall Street analysts forecast SJM stock price to rise over the next 12 months. According to Wall Street analysts, the average 1-year price target for SJM is 119.00 USD with a low forecast of 105.00 USD and a high forecast of 130.00 USD. However, analyst price targets are subjective and often lag stock prices, so investors should focus on the objective reasons behind analyst rating changes, which better reflect the company's fundamentals.
6 Buy
8 Hold
0 Sell
Moderate Buy
Current: 99.610
sliders
Low
105.00
Averages
119.00
High
130.00
Current: 99.610
sliders
Low
105.00
Averages
119.00
High
130.00
Morgan Stanley
Overweight
maintain
$118 -> $115
2025-11-26
Reason
Morgan Stanley
Price Target
$118 -> $115
2025-11-26
maintain
Overweight
Reason
Morgan Stanley lowered the firm's price target on J.M. Smucker to $115 from $118 and keeps an Overweight rating on the shares. The firm does not think shares being down about 370 basis points on the day of earnings was "unfair" in light of more constructive sentiment and many investors hoping for upside versus an in-line Q2 and unchanged midpoint of fiscal year guidance, the analyst tells investors. Post Q2, the firm is lowering its estimates by a low-to-mid single digit percentage, the analyst added.
UBS
Peter Grom
Buy
downgrade
$120 -> $117
2025-11-26
Reason
UBS
Peter Grom
Price Target
$120 -> $117
2025-11-26
downgrade
Buy
Reason
UBS analyst Peter Grom lowered the firm's price target on J.M. Smucker to $117 from $120 and keeps a Buy rating on the shares. Solid organic growth was offset by weaker gross margin in the quarter, the analyst tells investors in a research note.
JPMorgan
Neutral
maintain
$122 -> $121
2025-11-26
Reason
JPMorgan
Price Target
$122 -> $121
2025-11-26
maintain
Neutral
Reason
JPMorgan lowered the firm's price target on J.M. Smucker to $121 from $122 and keeps a Neutral rating on the shares.
BofA
Neutral
maintain
$118 -> $120
2025-11-26
Reason
BofA
Price Target
$118 -> $120
2025-11-26
maintain
Neutral
Reason
BofA raised the firm's price target on J.M. Smucker to $120 from $118 and keeps a Neutral rating on the shares after Q2 adjusted EPS came in slightly above BofA's forecast. The firm raised its FY27 and FY28 adjusted EPS forecasts to $10.00 and $10.80 from $9.80 and $10.60, respectively, noting that the company anticipates its momentum in FY26 to set up for an algorithm or better FY27, which means potential for $10-plus of EPS next year.
Stifel
Hold
maintain
$115 -> $110
2025-11-26
Reason
Stifel
Price Target
$115 -> $110
2025-11-26
maintain
Hold
Reason
Stifel lowered the firm's price target on J.M. Smucker to $110 from $115 and keeps a Hold rating on the shares after the company reported an in line second quarter. Smucker narrowed its FY26 guidance ranges for sales and EPS as the tailwind from less unfavorable coffee elasticities is mostly offset by a softer profit performance in Sweet Baked Snacks and Frozen Handheld and Spreads, notes the analyst, who thinks the base business momentum exiting the year and lower tariff costs should support robust earnings growth in FY27 even as the company continues to invest.
Bernstein
Bernstein
Market Perform
maintain
$110 -> $113
2025-11-26
Reason
Bernstein
Bernstein
Price Target
$110 -> $113
2025-11-26
maintain
Market Perform
Reason
Bernstein raised the firm's price target on J.M. Smucker to $113 from $110 and keeps a Market Perform rating on the shares. The firm says that overall, Smucker's seems to be hanging in there somewhat better than its peers. Organic sales growth of about 6% was driven mainly by low-double digit pricing, driven mainly by coffee, with underlying volumes down mid-single digits, Bernstein adds. Then again, adjusted EPS was down by 24% year-on-year, due mainly to coffee input cost inflation and tariffs, operational deleveraging and investments in marketing and innovation.
See All Ratings

Valuation Metrics

The current forward P/E ratio for J M Smucker Co (SJM.N) is 10.26, compared to its 5-year average forward P/E of 13.74. For a more detailed relative valuation and DCF analysis to assess J M Smucker Co 's fair value, click here.
  • Forward PE
  • Forward EV/EBITDA
  • Forward PS

Forward PE

The forward P/E ratio is a valuation metric that divides a company's current stock price by its estimated future earnings per share over the next 12 months.
StronglyUndervaluedUndervaluedFairOvervaluedStronglyOvervalueddotted line Image
Undervalued
5Y Average PE
13.74
Current PE
10.26
Overvalued PE
15.72
Undervalued PE
11.75

Forward EV/EBITDA

The forward EV/EBITDA ratio is a valuation metric that divides a company's enterprise value (EV) by its estimated future earnings before interest, taxes, depreciation, and amortization (EBITDA) over the next 12 months.
StronglyUndervaluedUndervaluedFairOvervaluedStronglyOvervalueddotted line Image
N/A
5Y Average EV/EBITDA
10.56
Current EV/EBITDA
0.00
Overvalued EV/EBITDA
11.76
Undervalued EV/EBITDA
9.36

Forward PS

The forward P/S ratio is a valuation metric that divides a company's current stock price by its estimated future sales (or revenue) per share over the next 12 months.
StronglyUndervaluedUndervaluedFairOvervaluedStronglyOvervalueddotted line Image
N/A
5Y Average PS
1.61
Current PS
0.00
Overvalued PS
1.87
Undervalued PS
1.35
AI Stock Picker
AI Stock Picker

Financials

Annual
Quarterly
N/A
Total Revenue
N/A
Operating Profit
N/A
Net Income after Tax
N/A
EPS - Diluted
N/A
Free Cash Flow
N/A
Gross Profit Margin - %
N/A
FCF Margin - %
N/A
Net Margin - %
N/A
ROIC

Trading Trends

  • Insider
  • Hedge Fund
  • Congress Trading
Insider
Insiders are Neutral. There are no significant trading trends over the last month.
Sold
Bought
Hedge Fund
Hedge Funds are Neutral. There are no significant trading trends over the last quarter.
Sold
Bought
Congress Trading
Congress are Neutral. There are no significant trading trends over the last month.
Sold
Bought
Insider
Insiders are Neutral. There are no significant trading trends over the last month.
Sold
Bought
Intellectia AI SwingMax

SJM News & Events

Events Timeline

(ET)
2025-11-25
07:04:59
J.M. Smucker revises FY26 adjusted EPS forecast to a range of $8.75-$9.25, down from $8.50-$9.50
select
2025-11-25
07:02:40
J.M. Smucker announces Q2 adjusted earnings per share of $2.10, matching expectations
select
2025-11-17 (ET)
2025-11-17
12:24:37
Video: Meet the Wall Street-Approved Winners from Food Tariff Relief
select
link
Sign Up For More Events

News

[object Object]
Preview
4.5
12-03NASDAQ.COM
Stocks Close Up Driven by Gains in Chip Manufacturers and Boeing
  • Market Performance: The S&P 500, Dow Jones, and Nasdaq 100 all closed higher, with the Nasdaq reaching a 2.5-week high, driven by strong earnings in the tech sector, particularly from MongoDB and Boeing.

  • OECD Economic Forecast: The OECD maintained its global GDP forecast for 2025 at +3.2% but raised the US forecast to +2.0%, citing resilience against trade tariffs and strong investment in AI.

  • Upcoming Economic Data: Key US economic indicators are set to be released this week, including employment changes, manufacturing production, and personal spending, with markets anticipating a high probability of a rate cut at the next FOMC meeting.

  • Corporate Earnings Highlights: Q3 earnings season showed strong results, with 83% of S&P 500 companies exceeding forecasts, and notable stock movements included significant gains for semiconductor companies and MongoDB, while some defensive stocks declined.

[object Object]
Preview
6.0
11-27NASDAQ.COM
Stifel Upholds Hold Rating for J. M. Smucker (SJM)
  • Analyst Recommendation: Stifel maintains a "Hold" recommendation for J. M. Smucker (NYSE:SJM) with an average one-year price target of $118.87/share, indicating an 18.42% potential upside from its current price of $100.38/share.

  • Revenue and EPS Projections: The projected annual revenue for J. M. Smucker is $8,802 million, reflecting a slight increase of 0.33%, while the projected non-GAAP EPS is expected to decrease by 7.38% to 11.05.

  • Fund Sentiment: There are 1,410 funds reporting positions in J. M. Smucker, with a slight decrease in ownership by 1.40% over the last quarter, although the average portfolio weight dedicated to SJM has increased by 7.20%.

  • Shareholder Activity: Notable changes in shareholder allocations include Barclays increasing its stake by 79.46%, while other firms like Vanguard and Invesco have decreased their portfolio allocations significantly over the last quarter.

[object Object]
Preview
6.0
11-27NASDAQ.COM
Bernstein Upholds Market Perform Rating for J. M. Smucker (SJM)
  • Analyst Recommendation: Bernstein has maintained a "Market Perform" rating for J. M. Smucker (NYSE:SJM) as of November 26, 2025, with an average one-year price target of $118.87/share, indicating an 18.42% potential upside from its current price of $100.38/share.

  • Financial Projections: The projected annual revenue for J. M. Smucker is $8,802 million, reflecting a slight increase of 0.33%, while the projected non-GAAP EPS is expected to decrease by 7.38% to 11.05.

  • Institutional Ownership Trends: There are currently 1,410 funds reporting positions in J. M. Smucker, with a slight decrease in ownership by 1.40% over the last quarter, although the average portfolio weight dedicated to SJM has increased by 7.20%.

  • Shareholder Activity: Notable changes in shareholder allocations include Barclays increasing its stake by 79.46%, while other firms like Vanguard and Invesco have reduced their holdings significantly over the last quarter.

Sign Up For More News

People Also Watch

FAQ

arrow icon

What is J M Smucker Co (SJM) stock price today?

The current price of SJM is 99.61 USD — it has decreased -0.75 % in the last trading day.

arrow icon

What is J M Smucker Co (SJM)'s business?

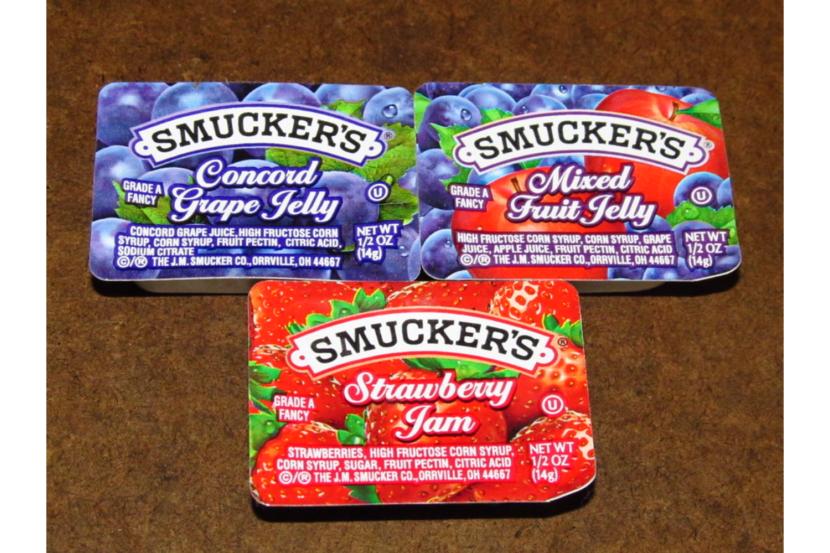
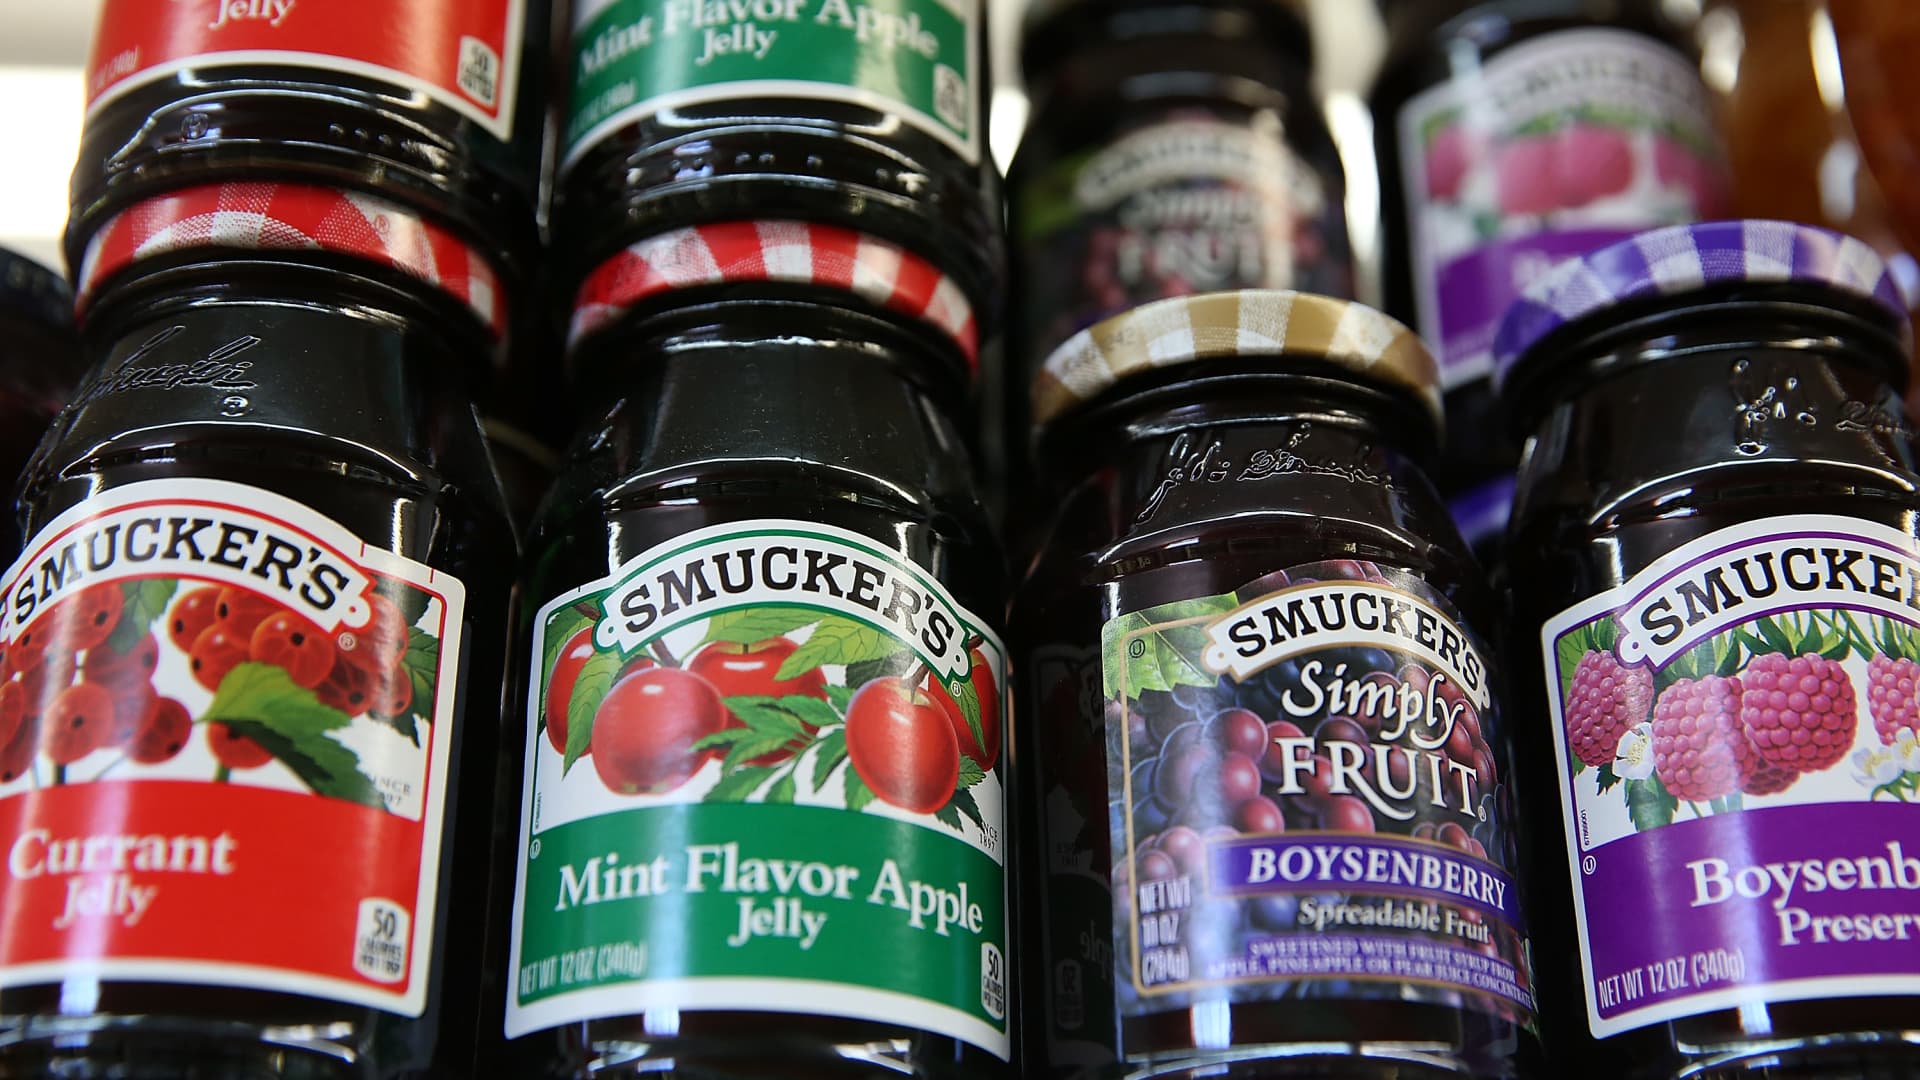
The J. M. Smucker Company is engaged in the manufacturing and marketing of branded food and beverage products on a worldwide basis. The Company’s branded food and beverage products include a portfolio of brands that are sold to consumers primarily through retail outlets in North America. The Company operates through four segments: U.S. Retail Coffee, U.S. Retail Frozen Handheld and Spreads, and U.S. Retail Pet Foods, and Sweet Baked Snacks. The U.S. Retail Coffee segment primarily includes the domestic sales of Folgers, Dunkin’, and Cafe Bustelo branded coffee. The U.S. Retail Frozen Handheld and Spreads segment primarily includes the domestic sales of Uncrustables, Jif, and Smucker’s branded products. The U.S. Retail Pet Foods segment primarily includes the domestic sales of Meow Mix, Milk-Bone, Pup-Peroni, and Canine Carry Outs branded products. The Sweet Baked Snacks segment primarily includes all domestic and foreign sales of Hostess branded products across all channels.

arrow icon

What is the price predicton of SJM Stock?

Wall Street analysts forecast SJM stock price to rise over the next 12 months. According to Wall Street analysts, the average 1-year price target for SJM is 119.00 USD with a low forecast of 105.00 USD and a high forecast of 130.00 USD. However, analyst price targets are subjective and often lag stock prices, so investors should focus on the objective reasons behind analyst rating changes, which better reflect the company's fundamentals.

arrow icon

What is J M Smucker Co (SJM)'s revenue for the last quarter?

J M Smucker Co revenue for the last quarter amounts to 2.33B USD, increased 2.59 % YoY.

arrow icon

What is J M Smucker Co (SJM)'s earnings per share (EPS) for the last quarter?

J M Smucker Co. EPS for the last quarter amounts to 2.26 USD, decreased -1082.61 % YoY.

arrow icon

What changes have occurred in the market's expectations for J M Smucker Co (SJM)'s fundamentals?

The market is revising Upward the revenue expectations for The J. M. Smucker Company (SJM) for FY2026, with the revenue forecasts being adjusted by 0.05% over the past three months. During the same period, the stock price has changed by -11.47%.
arrow icon

How many employees does J M Smucker Co (SJM). have?

J M Smucker Co (SJM) has 8000 emplpoyees as of December 05 2025.

arrow icon

What is J M Smucker Co (SJM) market cap?

Today SJM has the market capitalization of 10.63B USD.

Intellectia LogoIntellectiaIntellectia LogoIntellectia

Redefine Your Investment Decisions

TwitterTwitterYoutubeYoutubeQuoraQuoraDiscordDiscordLinkedinLinkedinTelegramTelegram
AppStoreGooglePlay

Copyright © 2025 Intellectia.AI. All Rights Reserved.

pci certified logo
Company
HomeContactAbout UsNews Release
Compare
TradingViewSeeking Alpha
Features
Financial AI AgentStock Technical AnalysisStock MonitorHedge Fund TrackerAI ScreenerDaytrading Center
Strategies
AI Stock PickerSwing TradingStock Chart PatternsEarnings TradingDaytrading CenterAI Earnings PredictionQuant AIWhales Auto TrackerBacktesting Playground
Free Tools
Dividend CalculatorDividend Yield CalculatorOptions Profit Calculator
Resource
BlogTutorialEarningsTrending StocksCrypto MarketPartner ProgramTerms of UsePrivacy PolicySecuritySitemap
Start for Free