SQM Overview
-
$
0.000
0.000(0.000%)
At close0.000(0.000%)Aft-market
ET
Loading chart...

The current price of SQM is 75.43 USD — it has decreased -2.91
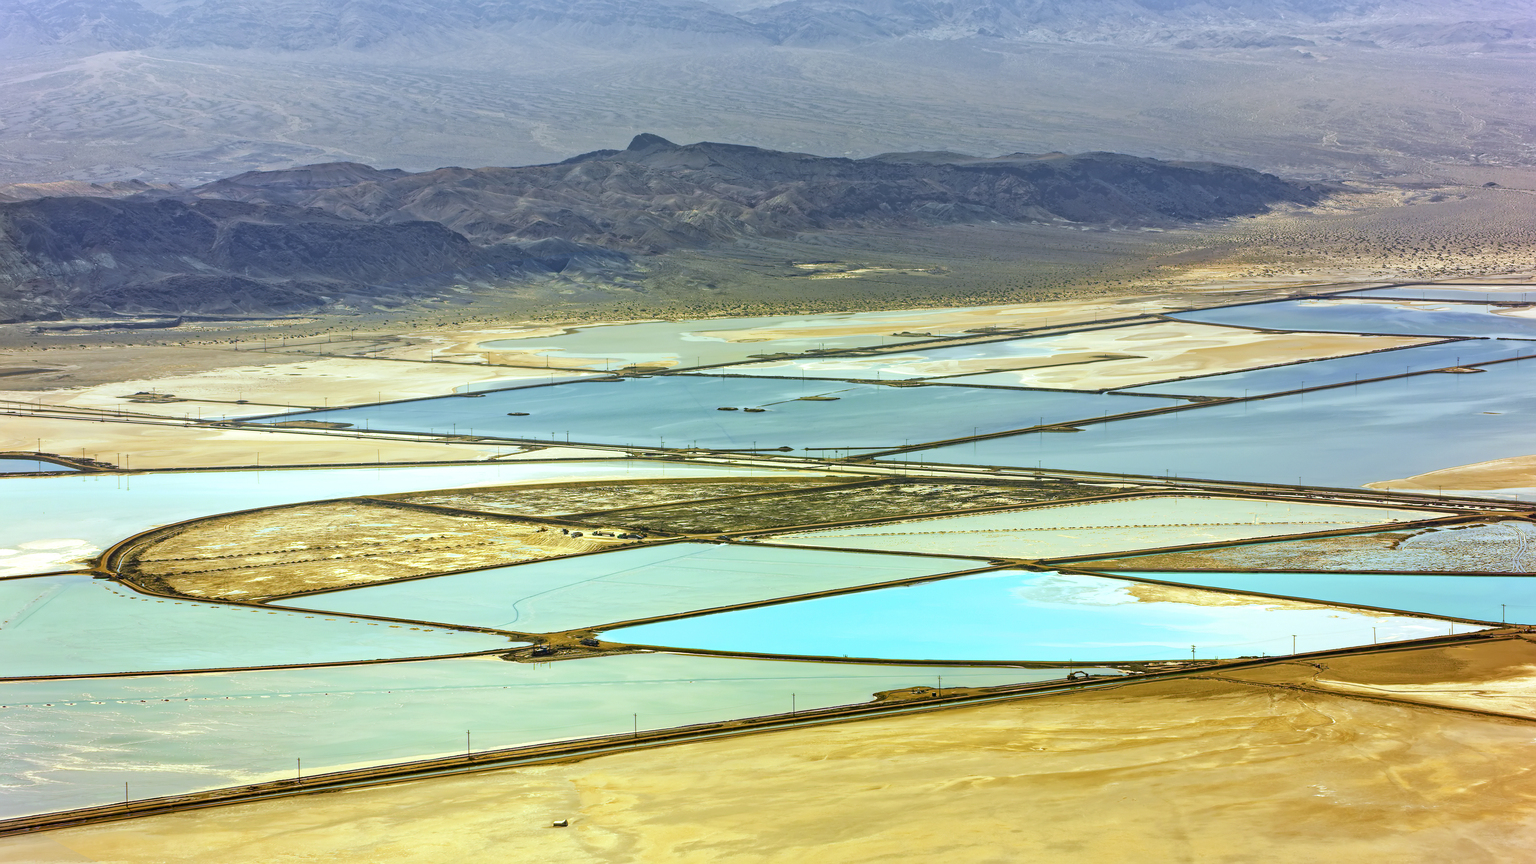
Sociedad Quimica y Minera de Chile SA (SQM), is a producer of potassium nitrate and iodine. The Company produces specialty plant nutrients, iodine derivatives, lithium and its derivatives, potassium chloride, potassium sulfate and certain industrial chemicals. Its segments include specialty plant nutrients, industrial chemicals, iodine and derivatives, lithium and derivatives, potassium, and other products and services. Specialty plant nutrients are fertilizers that enable farmers to improve yields. Industrial chemicals have a range of applications in chemical processes, such as the manufacturing of glass and industrial nitrates. Iodine and its derivatives are used in the X-ray contrast media and biocides industries, among others. Lithium and its derivatives are used in batteries, greases and frits for production of ceramics. Potassium chloride is a commodity fertilizer that is produced and sold by the Company across the world.
Wall Street analysts forecast SQM stock price to rise over the next 12 months. According to Wall Street analysts, the average 1-year price target for SQM is64.28 USD with a low forecast of 43.50 USD and a high forecast of 80.00 USD. However, analyst price targets are subjective and often lag stock prices, so investors should focus on the objective reasons behind analyst rating changes, which better reflect the company's fundamentals.
Sociedad Quimica y Minera de Chile SA revenue for the last quarter amounts to 1.76B USD, increased 69.79
Sociedad Quimica y Minera de Chile SA. EPS for the last quarter amounts to 1.28 USD, increased 166.67
Sociedad Quimica y Minera de Chile SA (SQM) has 7739 emplpoyees as of June 06 2026.
Today SQM has the market capitalization of 22.19B USD.