Intellectia LogoIntellectia
Product
Resources
Markets
News
Partner Program
Pricing
Log inTry for Free
Intellectia Logo
Log in
Intellectia Logo

Product

Features
Financial AI Agent
Stock Technical Analysis
Stock Monitor
Hedge Fund Tracker
AI Screener
Trading Strategies
AI Stock Picker
Swing Trading
Quant AI
Stock Chart Patterns
Daytrading Center
AI Earnings Prediction
Whales Auto Tracker
Backtesting Playground

Resources

Learn
Blog
Earnings
Tutorial
Help Center
Company
About Us
Contact
Press
Reward Program
Partner Program
Tools
Dividend Calculator
Dividend Yield Calculator
Options Profit Calculator
Compare
TradingView
SeekingAlpha

Markets

Trending Stocks
Hot Crypto
Trending News
All Stocks

News

Trading News
Overview
Top News
Daily Market Brief
Earnings
Latest
Newswire
Stock News
Crypto News
Monitor News
Partner ProgramPricing
Start for Free
  1. Home
  2. >
  3. Stock
  4. >
  5. SHW
stocks logo

SHW

-
collectAdd to Watchlistadvanced chartAdvanced Chart
$
0.000
0(0.000%)1D
collectadvanced chart
    Overview
    Forecast
    Valuation
    Earnings
High
--
Open
--
VWAP
--
Vol
--
Mkt Cap
--
Low
--
Amount
--
EV/EBITDA(TTM)
--
Total Shares
--
EV
--
EV/OCF(TTM)
--
P/S(TTM)
--
AI Stock Picker
AI Stock Picker

Market Estimates

Earnings Estimates
Earnings Estimates
Revenue
YoY Chg
EPS
YoYChg
FY2025Q4
FY2026Q1
FY2026Q2
5.57B
+5.08%
2.164
+3.54%
5.58B
+5.23%
2.405
+6.87%
6.65B
+5.26%
3.778
+11.77%
Estimates Revision
The market is revising Upward the revenue expectations for The Sherwin-Williams Company (SHW) for FY2025, with the revenue forecasts being adjusted by 1.23% over the past three months. During the same period, the stock price has changed by -8.31%.
Revenue Estimates for FY2025
Revise Upward
up Image
+1.23%
In Past 3 Month
EPS Estimates for FY2025
Revise Upward
up Image
+0.4%
In Past 3 Month
Stock Price
Go Down
down Image
-8.31%
In Past 3 Month
Wall Street analysts forecast SHW stock price to rise over the next 12 months. According to Wall Street analysts, the average 1-year price target for SHW is 395.00 USD with a low forecast of 370.00 USD and a high forecast of 422.00 USD. However, analyst price targets are subjective and often lag stock prices, so investors should focus on the objective reasons behind analyst rating changes, which better reflect the company's fundamentals.
11 Analyst Rating
Wall Street analysts forecast SHW stock price to rise over the next 12 months. According to Wall Street analysts, the average 1-year price target for SHW is 395.00 USD with a low forecast of 370.00 USD and a high forecast of 422.00 USD. However, analyst price targets are subjective and often lag stock prices, so investors should focus on the objective reasons behind analyst rating changes, which better reflect the company's fundamentals.
8 Buy
3 Hold
0 Sell
Moderate Buy
Current: 335.370
sliders
Low
370.00
Averages
395.00
High
422.00
Current: 335.370
sliders
Low
370.00
Averages
395.00
High
422.00
Citi
Patrick Cunningham
Neutral
maintain
$380 -> $392
2025-10-30
Reason
Citi
Patrick Cunningham
Price Target
$380 -> $392
2025-10-30
maintain
Neutral
Reason
Citi analyst Patrick Cunningham raised the firm's price target on Sherwin-Williams to $392 from $380 and keeps a Neutral rating on the shares.
RBC Capital
Outperform
maintain
$400 -> $405
2025-10-29
Reason
RBC Capital
Price Target
$400 -> $405
2025-10-29
maintain
Outperform
Reason
RBC Capital raised the firm's price target on Sherwin-Williams to $405 from $400 and keeps an Outperform rating on the shares. The company's Q3 earnings beat estimates, though its narrowed FY25 outlook reflects "continued choppy demand", the analyst tells investors in a research note.
Mizuho
NULL -> Outperform
maintain
$385 -> $400
2025-10-29
Reason
Mizuho
Price Target
$385 -> $400
2025-10-29
maintain
NULL -> Outperform
Reason
Mizuho raised the firm's price target on Sherwin-Williams to $400 from $385 and keeps an Outperform rating on the shares.
Wells Fargo
Michael Sison
Overweight
maintain
$395 -> $410
2025-10-29
Reason
Wells Fargo
Michael Sison
Price Target
$395 -> $410
2025-10-29
maintain
Overweight
Reason
Wells Fargo analyst Michael Sison raised the firm's price target on Sherwin-Williams to $410 from $395 and keeps an Overweight rating on the shares. The firm remains bullish given volumes and EPS is coming in better than expected for the second half of 2025 despite no improvement in demand.
UBS
Buy
maintain
$400 -> $422
2025-10-29
Reason
UBS
Price Target
$400 -> $422
2025-10-29
maintain
Buy
Reason
UBS raised the firm's price target on Sherwin-Williams to $422 from $400 and keeps a Buy rating on the shares. UBS believes Sherwin-Williams can deliver more than 10% adjusted EPS growth in 2026 before considering any significant turn in the housing market, the analyst tells investors in a research note, adding that when layered in that eventual improving in U.S. housing/construction activity, that can lead to a multi-year period of high-teens adjusted EPS growth.
JPMorgan
NULL -> Overweight
maintain
$378 -> $385
2025-10-29
Reason
JPMorgan
Price Target
$378 -> $385
2025-10-29
maintain
NULL -> Overweight
Reason
JPMorgan raised the firm's price target on Sherwin-Williams to $385 from $378 and keeps an Overweight rating on the shares.
See All Ratings

Valuation Metrics

The current forward P/E ratio for Sherwin-Williams Co (SHW.N) is 27.65, compared to its 5-year average forward P/E of 27.76. For a more detailed relative valuation and DCF analysis to assess Sherwin-Williams Co 's fair value, click here.
  • Forward PE
  • Forward EV/EBITDA
  • Forward PS

Forward PE

The forward P/E ratio is a valuation metric that divides a company's current stock price by its estimated future earnings per share over the next 12 months.
StronglyUndervaluedUndervaluedFairOvervaluedStronglyOvervalueddotted line Image
Fair
5Y Average PE
27.76
Current PE
27.65
Overvalued PE
31.96
Undervalued PE
23.57

Forward EV/EBITDA

The forward EV/EBITDA ratio is a valuation metric that divides a company's enterprise value (EV) by its estimated future earnings before interest, taxes, depreciation, and amortization (EBITDA) over the next 12 months.
StronglyUndervaluedUndervaluedFairOvervaluedStronglyOvervalueddotted line Image
N/A
5Y Average EV/EBITDA
20.64
Current EV/EBITDA
0.00
Overvalued EV/EBITDA
22.99
Undervalued EV/EBITDA
18.29

Forward PS

The forward P/S ratio is a valuation metric that divides a company's current stock price by its estimated future sales (or revenue) per share over the next 12 months.
StronglyUndervaluedUndervaluedFairOvervaluedStronglyOvervalueddotted line Image
N/A
5Y Average PS
3.30
Current PS
0.00
Overvalued PS
3.78
Undervalued PS
2.82
Financial AI Agent
Financial AI Agent

Financials

Annual
Quarterly
N/A
Total Revenue
N/A
Operating Profit
N/A
Net Income after Tax
N/A
EPS - Diluted
N/A
Free Cash Flow
N/A
Gross Profit Margin - %
N/A
FCF Margin - %
N/A
Net Margin - %
N/A
ROIC

Trading Trends

  • Insider
  • Hedge Fund
  • Congress Trading
Insider
Insiders are Neutral. There are no significant trading trends over the last month.
Sold
Bought
Hedge Fund
Hedge Funds are Neutral. There are no significant trading trends over the last quarter.
Sold
Bought
Congress Trading
Congress areSelling! The selling amount has increased406.25%over the last month.
Sold
Bought
Insider
Insiders are Neutral. There are no significant trading trends over the last month.
Sold
Bought
Intellectia AI SwingMax

SHW News & Events

Events Timeline

(ET)
2025-11-03
16:19:32
Sherwin-Williams appoints Benjamin Meisenzahl as Chief Financial Officer
select
2025-10-28 (ET)
2025-10-28
09:55:01
Significant Early Gainers in Liquid Options on October 28th
select
2025-10-28
07:05:25
Sherwin-Williams anticipates low-single-digit revenue growth for FY25, rising from $23.1 billion in FY24.
select
Sign Up For More Events

News

[object Object]
Preview
4.5
12-02NASDAQ.COM
Significant Withdrawals Observed in ETF for DIA, HD, SHW, MCD
  • 52-Week Range Analysis: DIA's share price has a 52-week low of $366.32 and a high of $484.395, with the last trade recorded at $474.55, indicating a strong position within its range.

  • Understanding ETFs: Exchange traded funds (ETFs) function like stocks, where investors buy and sell "units" that can be created or destroyed based on demand, affecting the underlying assets.

  • Monitoring ETF Flows: Weekly analysis of shares outstanding helps identify ETFs with significant inflows or outflows, which can influence the buying or selling of their underlying holdings.

  • Disclaimer on Views: The opinions expressed in the article are those of the author and do not necessarily represent the views of Nasdaq, Inc.

[object Object]
Preview
9.5
11-27NASDAQ.COM
What Caused Sherwin-Williams (SHW) to Decline 0.7% Since Its Last Earnings Report?
  • Recent Earnings Performance: Sherwin-Williams reported Q3 2025 earnings of $3.35 per share, a 5.3% increase from the previous year, with revenues of approximately $6.36 billion, surpassing estimates.

  • Segment Performance: The Paint Stores Group saw a 5.1% increase in net sales, while the Consumer Brands Group experienced a 2.6% decline due to weak DIY demand, though European sales helped mitigate losses.

  • Future Projections: For Q4 and full-year 2025, Sherwin-Williams expects low to mid-single-digit growth in net sales, with projected net income per share between $10.16 and $10.36.

  • Investor Sentiment: Recent estimates for Sherwin-Williams have trended downward, resulting in a Zacks Rank #3 (Hold) and an aggregate VGM Score of D, indicating a cautious outlook for the stock.

[object Object]
Preview
4.5
11-24NASDAQ.COM
Significant Withdrawals Observed in ETF for DIA, SHW, HON, BA
  • 52-Week Range Analysis: DIA's share price has a 52-week low of $366.32 and a high of $484.395, with the last trade recorded at $463.67.

  • Understanding ETFs: Exchange traded funds (ETFs) function like stocks, where investors buy and sell "units" that can be created or destroyed based on demand.

  • Monitoring ETF Flows: Weekly analysis of shares outstanding helps identify ETFs with significant inflows (new units created) or outflows (units destroyed), impacting the underlying assets.

  • Author's Perspective: The opinions expressed in the article are those of the author and do not necessarily represent Nasdaq, Inc.

Sign Up For More News

People Also Watch

FAQ

arrow icon

What is Sherwin-Williams Co (SHW) stock price today?

The current price of SHW is 335.37 USD — it has decreased -1.14 % in the last trading day.

arrow icon

What is Sherwin-Williams Co (SHW)'s business?

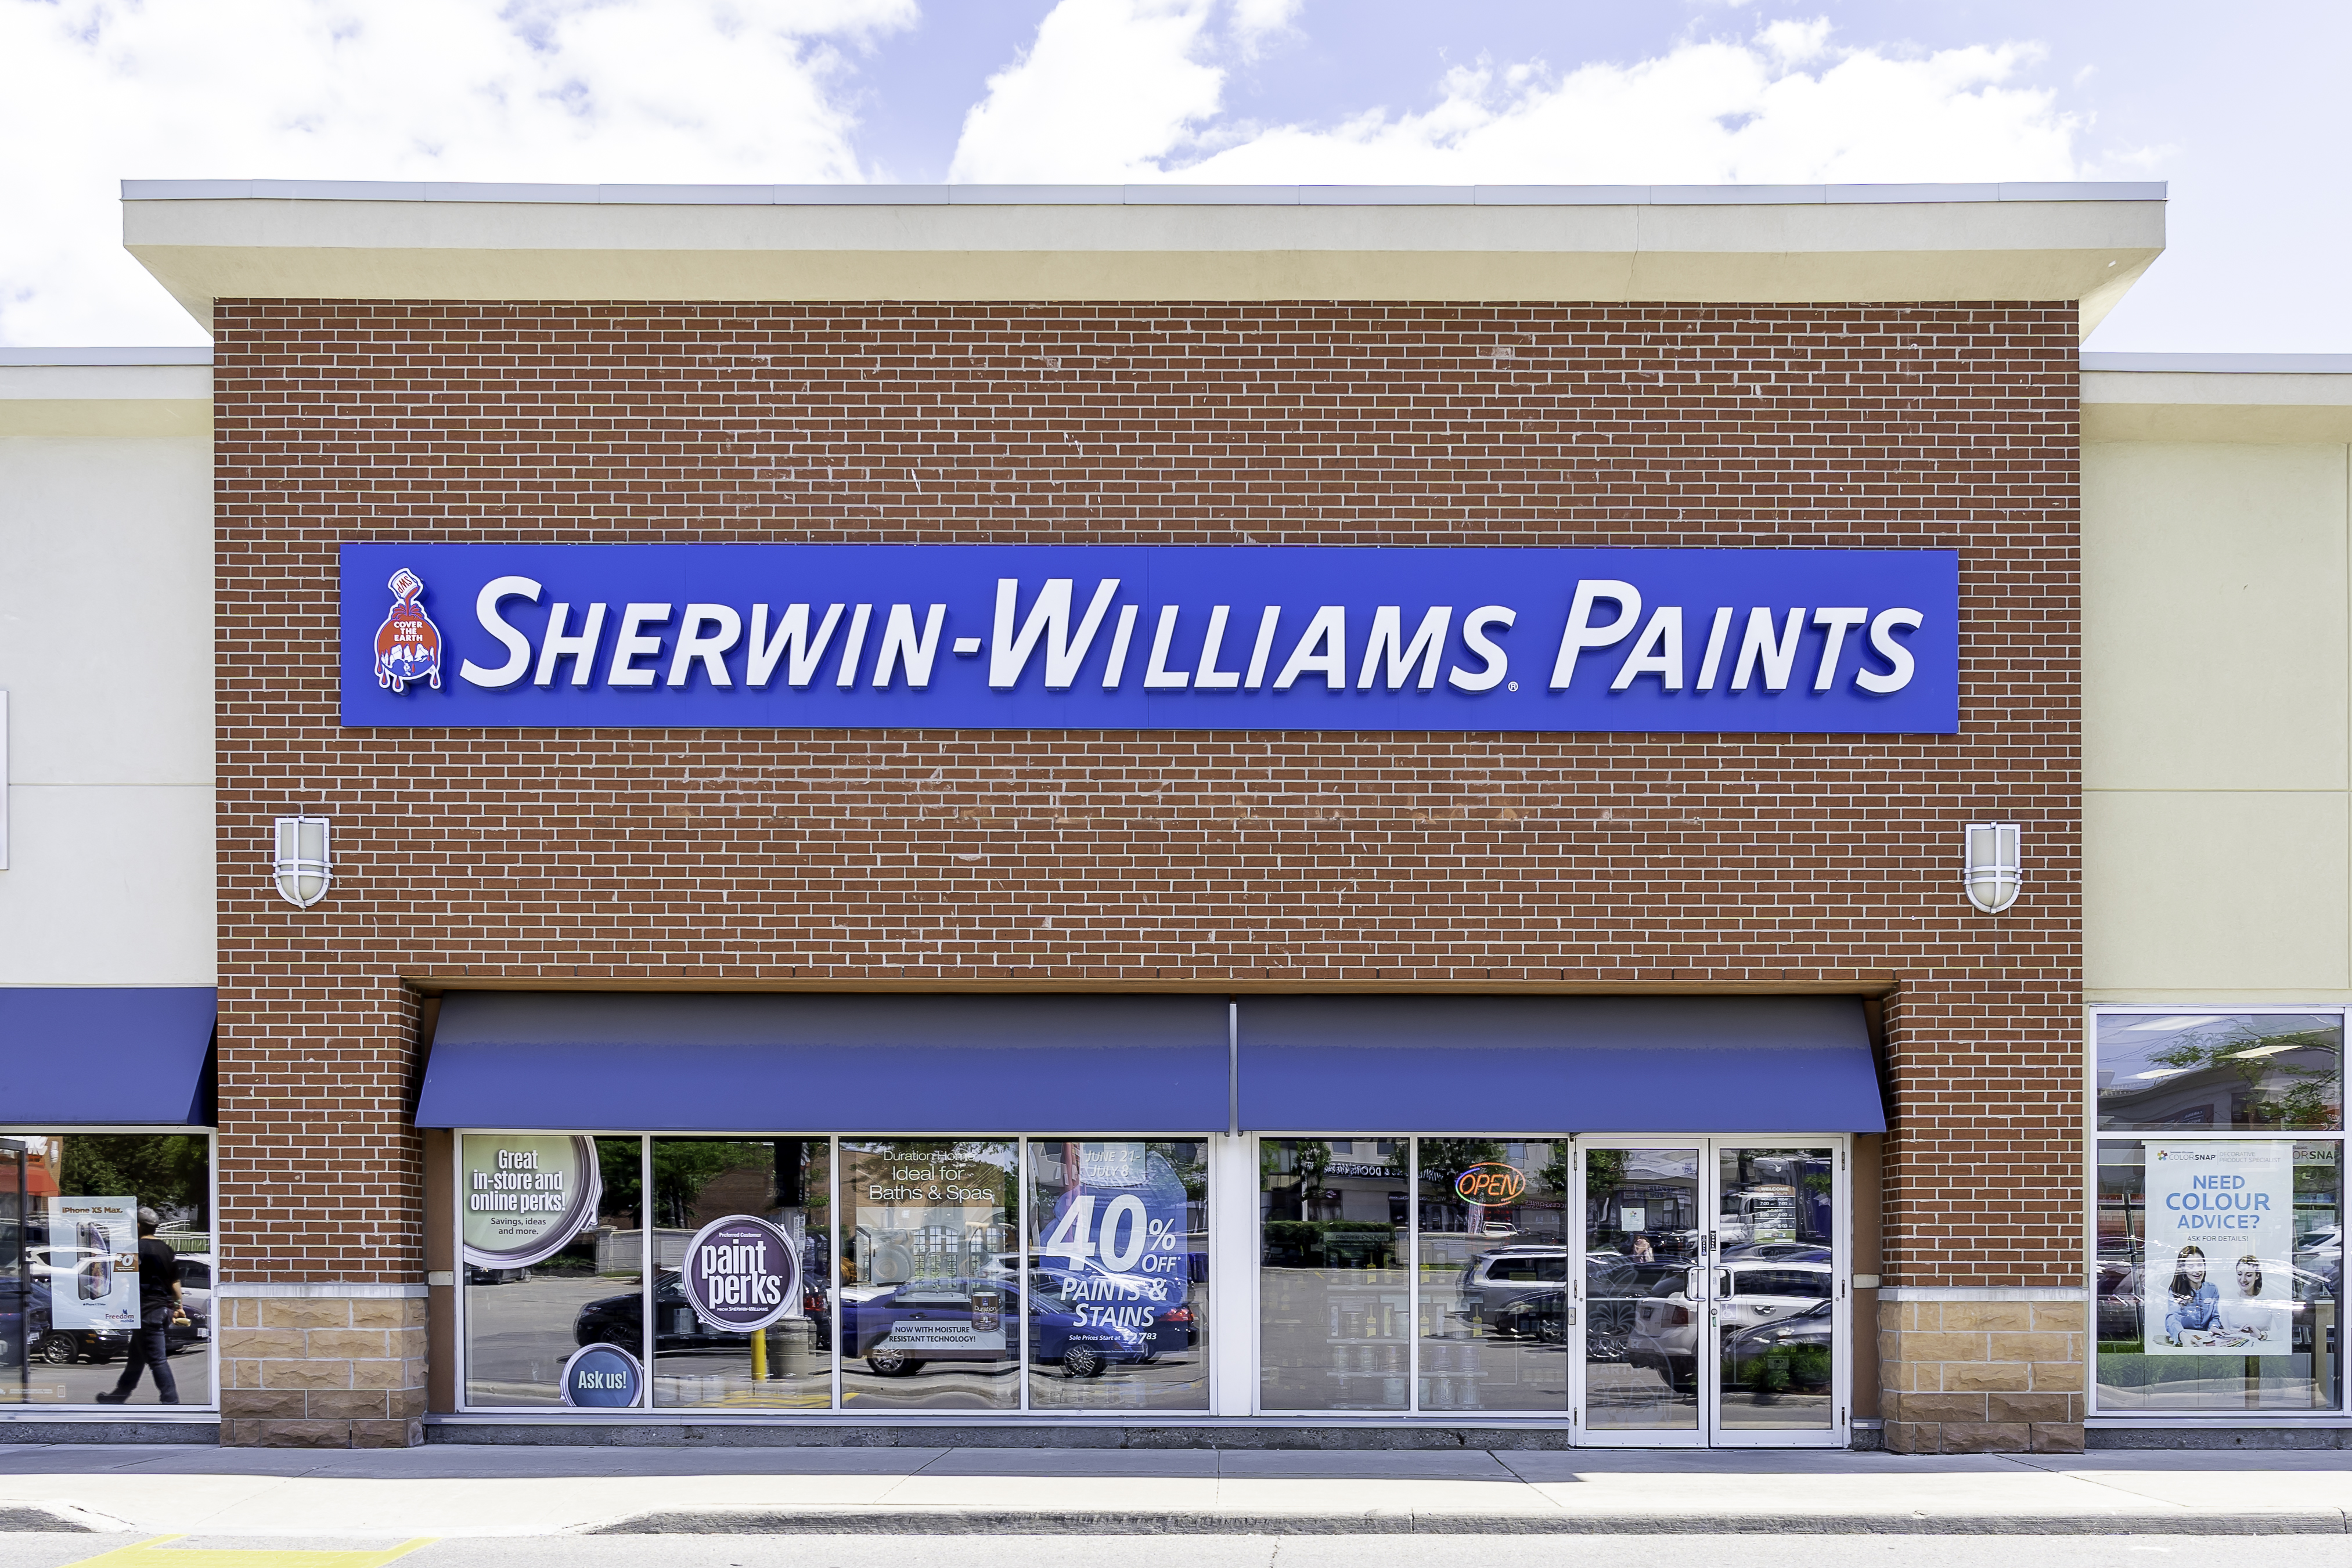
The Sherwin-Williams Company is engaged in the manufacture, development, distribution, and sale of paint, coatings and related products to professional, industrial, commercial, and retail customers primarily in North and South America with additional operations in the Caribbean region, Europe, Asia and Australia. Its Paint Stores Group segment is engaged in servicing the needs of architectural and industrial paint contractors and do-it-yourself homeowners. The Consumer Brands Group segment manufactures and distributes a broad portfolio of branded and private-label architectural paint, stains, varnishes, industrial products, wood finishes products, wood preservatives, applicators, corrosion inhibitors, aerosols, caulks and adhesives to retailers, including home centers and hardware stores, dedicated dealers and distributors. The Performance Coatings Group segment develops and sells industrial coatings for wood finishing and general industrial (metal and plastic) applications and others.

arrow icon

What is the price predicton of SHW Stock?

Wall Street analysts forecast SHW stock price to rise over the next 12 months. According to Wall Street analysts, the average 1-year price target for SHW is 395.00 USD with a low forecast of 370.00 USD and a high forecast of 422.00 USD. However, analyst price targets are subjective and often lag stock prices, so investors should focus on the objective reasons behind analyst rating changes, which better reflect the company's fundamentals.

arrow icon

What is Sherwin-Williams Co (SHW)'s revenue for the last quarter?

Sherwin-Williams Co revenue for the last quarter amounts to 6.36B USD, increased 3.18 % YoY.

arrow icon

What is Sherwin-Williams Co (SHW)'s earnings per share (EPS) for the last quarter?

Sherwin-Williams Co. EPS for the last quarter amounts to 3.35 USD, increased 5.35 % YoY.

arrow icon

What changes have occurred in the market's expectations for Sherwin-Williams Co (SHW)'s fundamentals?

The market is revising Upward the revenue expectations for The Sherwin-Williams Company (SHW) for FY2025, with the revenue forecasts being adjusted by 1.23% over the past three months. During the same period, the stock price has changed by -8.31%.
arrow icon

How many employees does Sherwin-Williams Co (SHW). have?

Sherwin-Williams Co (SHW) has 63890 emplpoyees as of December 05 2025.

arrow icon

What is Sherwin-Williams Co (SHW) market cap?

Today SHW has the market capitalization of 83.14B USD.

Intellectia LogoIntellectiaIntellectia LogoIntellectia

Redefine Your Investment Decisions

TwitterTwitterYoutubeYoutubeQuoraQuoraDiscordDiscordLinkedinLinkedinTelegramTelegram
AppStoreGooglePlay

Copyright © 2025 Intellectia.AI. All Rights Reserved.

pci certified logo
Company
HomeContactAbout UsNews Release
Compare
TradingViewSeeking Alpha
Features
Financial AI AgentStock Technical AnalysisStock MonitorHedge Fund TrackerAI ScreenerDaytrading Center
Strategies
AI Stock PickerSwing TradingStock Chart PatternsEarnings TradingDaytrading CenterAI Earnings PredictionQuant AIWhales Auto TrackerBacktesting Playground
Free Tools
Dividend CalculatorDividend Yield CalculatorOptions Profit Calculator
Resource
BlogTutorialEarningsTrending StocksCrypto MarketPartner ProgramTerms of UsePrivacy PolicySecuritySitemap
Start for Free