CDE Overview
-
$
0.000
0.000(0.000%)
At close0.000(0.000%)Aft-market
ET
Loading chart...

The current price of CDE is 17.51 USD — it has decreased -0.11
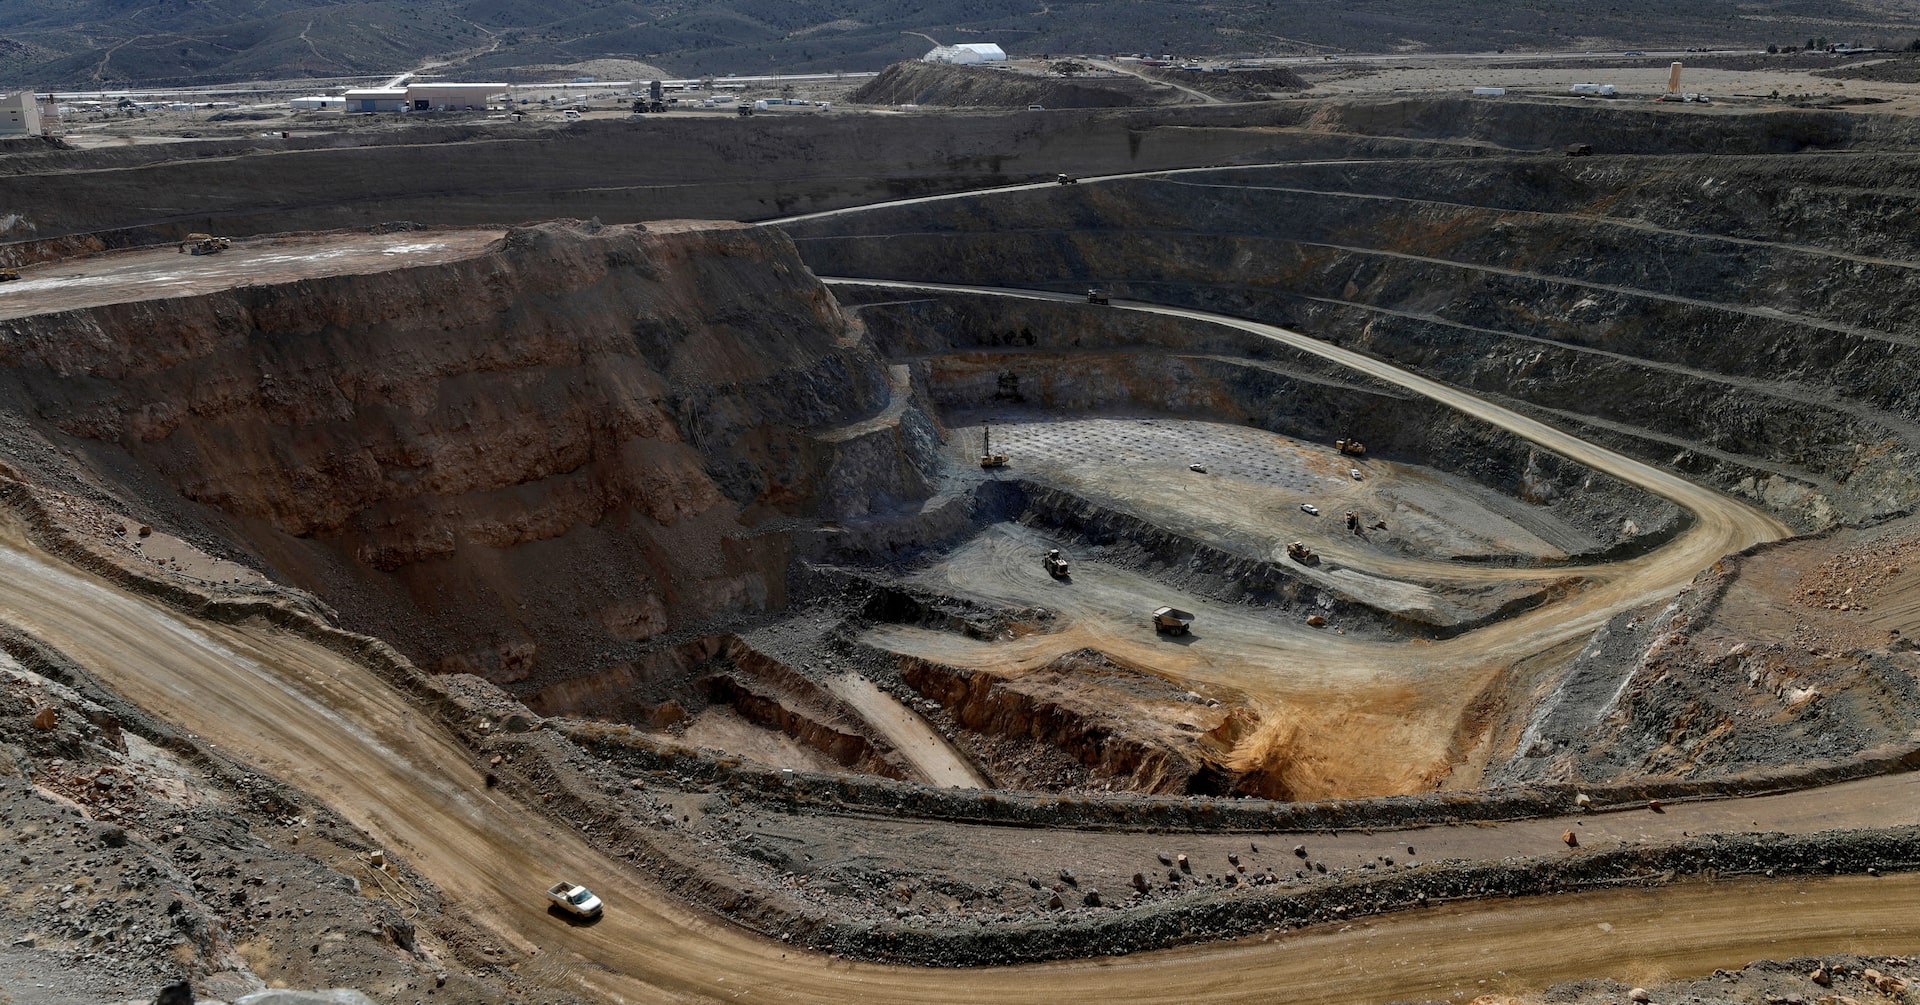
Coeur Mining, Inc. is a diversified precious metals producer with seven operations: the New Afton gold-copper mine in British Columbia, Canada, the Rainy River gold-silver mine in Ontario, Canada, the Las Chispas silver-gold mine in Sonora, Mexico, the Palmarejo gold-silver mine in Chihuahua, Mexico, the Rochester silver-gold mine in Nevada, the Kensington gold mine in Alaska and the Wharf gold mine in South Dakota. In addition, it owns the Silvertip polymetallic critical minerals' exploration project in British Columbia, Canada. The New Afton is an underground gold and copper mine located seven miles from Kamloops, British Columbia. Rainy River is an open-pit gold mine mid-transition to underground operations 40 miles northwest of Fort Frances, Ontario. The Las Chispas Operation is located approximately 220 kilometers (km) northeast of Hermosillo, Sonora, Mexico. The Palmarejo complex consists of the Palmarejo processing facility, and other nearby deposits and exploration targets.
Wall Street analysts forecast CDE stock price to rise over the next 12 months. According to Wall Street analysts, the average 1-year price target for CDE is21.86 USD with a low forecast of 16.00 USD and a high forecast of 25.00 USD. However, analyst price targets are subjective and often lag stock prices, so investors should focus on the objective reasons behind analyst rating changes, which better reflect the company's fundamentals.
Coeur Mining, Inc revenue for the last quarter amounts to 856.19M USD, increased 137.79
Coeur Mining, Inc. EPS for the last quarter amounts to 0.35 USD, increased 483.33
Coeur Mining, Inc (CDE) has 2620 emplpoyees as of June 21 2026.
Today CDE has the market capitalization of 18.04B USD.