PAAS Overview
-
$
0.000
0.000(0.000%)
At close0.000(0.000%)Aft-market
ET
Loading chart...

The current price of PAAS is 42.6 USD — it has decreased -3.53
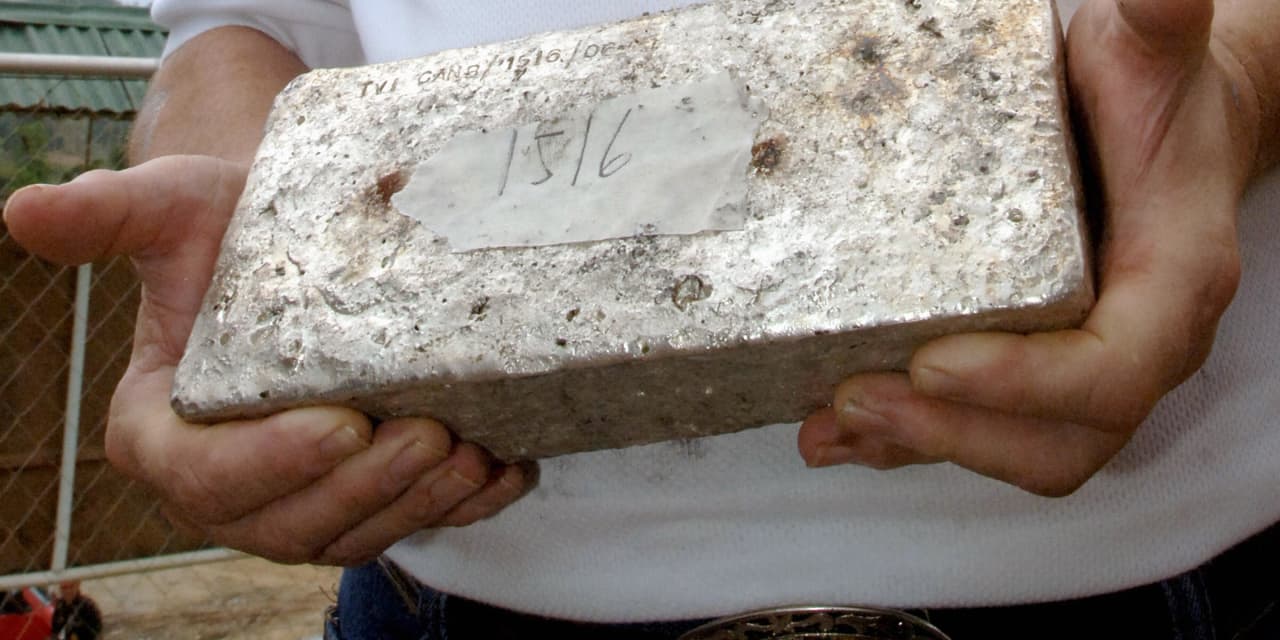
Pan American Silver Corp. is a producer of silver and gold in the Americas, operating mines in Canada, Mexico, Peru, Brazil, Bolivia, Chile and Argentina. It owns a 100% interest in the Escobal mine in Guatemala, and it holds interests in exploration and development projects. Its segments include Silver, Gold and Other. Silver segment includes operations of La Colorada, Huaron, San Vicente, Cerro Moro, La Colorada Skarn, Navidad and Escobal. Gold segment includes operations in Dolores, Shahuindo, Timmins, Jacobina, El Penon and Minera Florida. La Colorada mine produces silver-rich lead and zinc concentrates from a flotation plant treating sulfide ore. Huaron mine produces silver-rich zinc, lead and copper concentrates using floatation technology. It owns 44% joint venture interest in the Juanicipio silver mine in Zacatecas, Mexico, operated by Fresnillo plc, along with 100% ownership of the Larder exploration project and a 100% earn-in interest in the Deer Trail exploration project.
Wall Street analysts forecast PAAS stock price to rise over the next 12 months. According to Wall Street analysts, the average 1-year price target for PAAS is49.70 USD with a low forecast of 43.19 USD and a high forecast of 55.00 USD. However, analyst price targets are subjective and often lag stock prices, so investors should focus on the objective reasons behind analyst rating changes, which better reflect the company's fundamentals.
Pan American Silver Corp revenue for the last quarter amounts to 1.15B USD, increased 49.25
Pan American Silver Corp. EPS for the last quarter amounts to 1.08 USD, increased 129.79
Pan American Silver Corp (PAAS) has 9348 emplpoyees as of July 08 2026.
Today PAAS has the market capitalization of 18.61B USD.