
Line
|

Candle
1D
5D
1M
3M
6M
YTD
1Y
5Y
High
10.790
Open
10.450
VWAP
10.57
Vol
20.05M
Mkt Cap
5.81B
Low
10.380
Amount
211.97M
EV/EBITDA(TTM)
--
Total Shares
323.56M
EV
4.85B
EV/OCF(TTM)
--
P/S(TTM)
--
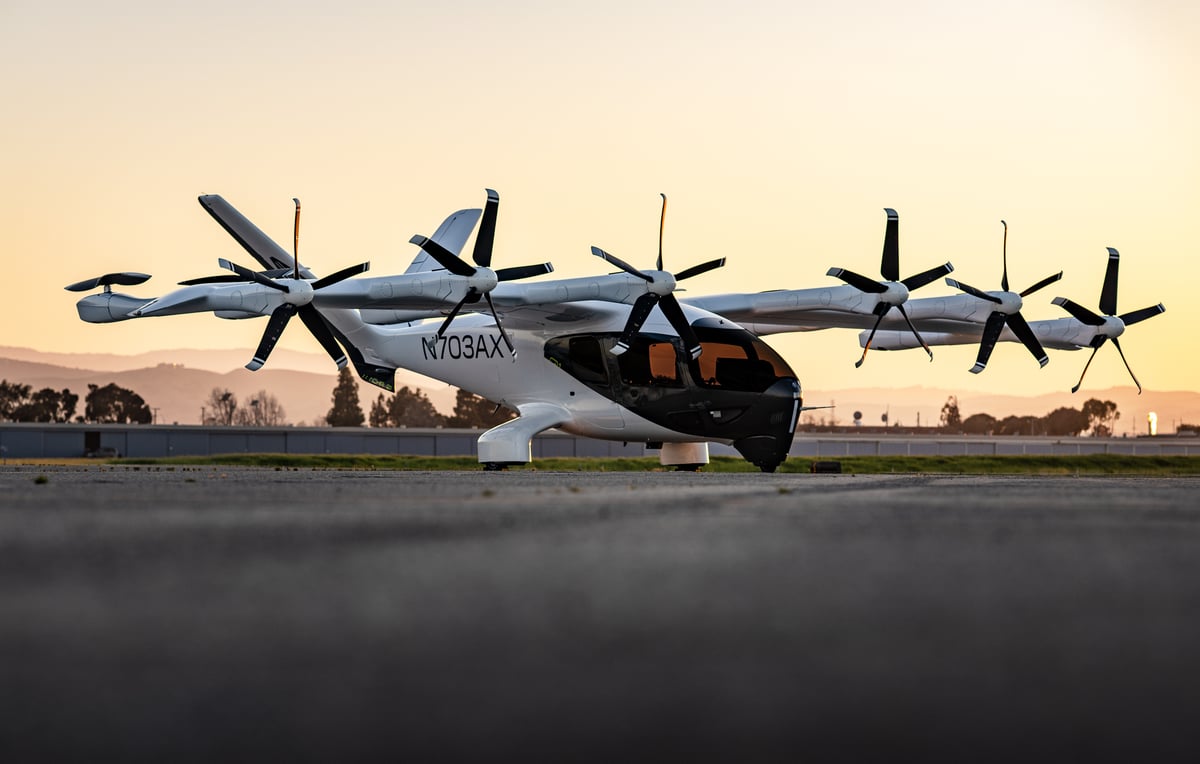
Archer Aviation Inc. is an aerospace company. The Company is engaged in designing and developing electric vertical takeoff and landing (eVTOL) aircraft for use in urban air mobility (UAM) networks. The Company’s eVTOL aircraft are designed to be safe, sustainable, and quiet. Its production aircraft, Midnight, is designed around its proprietary 12-tilt-6 aircraft configuration. Midnight is designed to carry four passengers plus a pilot optimized for back-to-back short distance trips of around 20-miles, with minimal charging time between trips. It intends to operate two complementary lines of business: a direct-to-consumer aerial ride share service (Archer UAM) and the sale of its aircraft to other operators (Archer Direct). Midnight is the evolution of its demonstrator eVTOL aircraft, Maker, which through its flight test program has helped validate its proprietary 12-tilt-6 aircraft configuration and certain key enabling technologies.
Show More
Market Estimates
Earnings Estimates
Revenue
YoY Chg
EPS
YoYChg
FY2025Q4
FY2025Q3
FY2025Q2
--
--
-0.200
-49%
--
--
-0.200
-11.77%
--
--
-0.197
-27.86%
Estimates Revision
The market is revising Downward the revenue expectations for Archer Aviation Inc. (ACHR) for FY2025, with the revenue forecasts being adjusted by -65.57% over the past three months. During the same period, the stock price has changed by 36.29%.
Revenue Estimates for FY2025
Revise Downward

-65.57%
In Past 3 Month
EPS Estimates for FY2025
Revise Upward

+7.78%
In Past 3 Month
Stock Price
Go Up

+36.29%
In Past 3 Month
7 Analyst Rating

21.15% Upside
Wall Street analysts forecast ACHR stock price to rise over the next 12 months. According to Wall Street analysts, the average 1-year price target for ACHR is 12.83 USD with a low forecast of 12.00 USD and a high forecast of 13.50 USD. However, analyst price targets are subjective and often lag stock prices, so investors should focus on the objective reasons behind analyst rating changes, which better reflect the company's fundamentals.
6 Buy
1 Hold
0 Sell
Strong Buy

21.15% Upside
Current: 10.590

Low
12.00
Averages
12.83
High
13.50

21.15% Upside
Current: 10.590

Low
12.00
Averages
12.83
High
13.50
Cantor Fitzgerald
Andres Sheppard
Buy
Reiterates
$13
2025-05-16
Reason
Cantor Fitzgerald
Andres Sheppard
Price Target
$13
2025-05-16
Reiterates
Buy
Reason
Needham
Chris Pierce
Strong Buy
Reiterates
$13
2025-05-13
Reason
Needham
Chris Pierce
Price Target
$13
2025-05-13
Reiterates
Strong Buy
Reason
HC Wainwright & Co.
Amit Dayal
Strong Buy
Reiterates
$13
2025-05-13
Reason
HC Wainwright & Co.
Amit Dayal
Price Target
$13
2025-05-13
Reiterates
Strong Buy
Reason
Needham
Chris Pierce
Strong Buy
Reiterates
$13
2025-04-21
Reason
Needham
Chris Pierce
Price Target
$13
2025-04-21
Reiterates
Strong Buy
Reason
HC Wainwright & Co.
Amit Dayal
Strong Buy
Reiterates
$13
2025-02-28
Reason
HC Wainwright & Co.
Amit Dayal
Price Target
$13
2025-02-28
Reiterates
Strong Buy
Reason
Needham
Chris Pierce
Strong Buy
Maintains
$11 → $13
2025-02-28
Reason
Needham
Chris Pierce
Price Target
$11 → $13
2025-02-28
Maintains
Strong Buy
Reason
See All Ratings
Valuation Metrics
The current forward P/E ratio for Archer Aviation Inc (ACHR.N) is -19.65, compared to its 5-year average forward P/E of -5.37. For a more detailed relative valuation and DCF analysis to assess Archer Aviation Inc 's fair value, click here.
Forward PE
The forward P/E ratio is a valuation metric that divides a company's current stock price by its estimated future earnings per share over the next 12 months.

N/A
5Y Average PE
-5.37
Current PE
-19.65
Overvalued PE
-2.29
Undervalued PE
-8.46
Forward EV/EBITDA
The forward EV/EBITDA ratio is a valuation metric that divides a company's enterprise value (EV) by its estimated future earnings before interest, taxes, depreciation, and amortization (EBITDA) over the next 12 months.

N/A
5Y Average EV/EBITDA
-3.53
Current EV/EBITDA
-17.28
Overvalued EV/EBITDA
-0.11
Undervalued EV/EBITDA
-6.95
Forward PS
The forward P/S ratio is a valuation metric that divides a company's current stock price by its estimated future sales (or revenue) per share over the next 12 months.

N/A
5Y Average PS
290.92
Current PS
206.32
Overvalued PS
887.87
Undervalued PS
-306.04
Financials
Annual
Quarterly
FY2025Q1
YoY :
+1.27%
-144.00M
Operating Profit
FY2025Q1
YoY :
-19.83%
-93.40M
Net Income after Tax
FY2025Q1
YoY :
-52.78%
-0.17
EPS - Diluted
FY2025Q1
YoY :
+0.77%
-104.60M
Free Cash Flow
Trading Trends
Insider
Insiders are Neutral. There are no significant trading trends over the last month.
Sold
0-3
Months
7.1M
USD
16
3-6
Months
11.3M
USD
8
6-9
Months
14.9M
USD
3
0-12
Months
0.0
USD
0
Bought
0-3
0
0.0
USD
Months
3-6
1
5.0M
USD
Months
6-9
2
139.7K
USD
Months
0-12
1
55.0M
USD
Months
Hedge Fund
Hedge Funds are Neutral. There are no significant trading trends over the last quarter.
Sold
0-3
Months
0.0
Volume
0
3-6
Months
417.4K
Volume
1
6-9
Months
0.0
Volume
0
0-12
Months
292.8K
Volume
2
Bought
0-3
0
0.0
Volume
Months
3-6
2
991.6K
Volume
Months
6-9
1
20.4M
Volume
Months
0-12
0
0.0
Volume
Months
Congress Trading
Congress are Neutral. There are no significant trading trends over the last month.
Sold
0-3
Months
0.0
USD
0
3-6
Months
0.0
USD
0
6-9
Months
0.0
USD
0
0-12
Months
0.0
USD
0
Bought
0-3
0
0.0
USD
Months
3-6
0
0.0
USD
Months
6-9
0
0.0
USD
Months
0-12
0
0.0
USD
Months
Insider
Insiders are Neutral. There are no significant trading trends over the last month.
Sold
0-3
Months
7.1M
USD
16
3-6
Months
11.3M
USD
8
6-9
Months
14.9M
USD
3
0-12
Months
0.0
USD
0
Bought
0-3
0
0.0
USD
Months
3-6
1
5.0M
USD
Months
6-9
2
139.7K
USD
Months
0-12
1
55.0M
USD
Months
ACHR News & Events
Events Timeline
2025-05-19 (ET)
2025-05-19
12:00:29
Archer Aviation falls -12.1%

2025-05-19
10:01:50
Archer Aviation falls -9.0%

2025-05-16 (ET)
2025-05-16
10:00:30
Archer Aviation rises 10.7%

Sign Up For More Events
News
6.5
05-23NASDAQ.COMWhy I'm Not Selling Archer Aviation Stock
7.5
05-22TipRanksIs Now the Right Time to Buy Archer Aviation Stock (ACHR)?
2.0
05-21BenzingaPalo Alto Networks, Take-Two Interactive Software, VF Corp And Other Big Stocks Moving Lower In Wednesday's Pre-Market Session
Sign Up For More News
People Also Watch

CVS
CVS Health Corp
60.830
USD
+1.01%

SMCI
Super Micro Computer Inc
40.090
USD
-2.98%

F
Ford Motor Co
10.360
USD
-0.77%

BLNK
Blink Charging Co
0.721
USD
+2.27%

DNA
Ginkgo Bioworks Holdings Inc
6.990
USD
+2.04%

PYPL
PayPal Holdings Inc
69.850
USD
-2.24%

ROKU
Roku Inc
69.010
USD
-1.09%

DKNG
Draftkings Inc
35.080
USD
+0.60%

DELL
Dell Technologies Inc
112.110
USD
+0.14%

GM
General Motors Co
48.690
USD
-1.20%
FAQ

What is Archer Aviation Inc (ACHR) stock price today?
The current price of ACHR is 10.59 USD — it has decreased -0.09 % in the last trading day.

What is Archer Aviation Inc (ACHR)'s business?

What is the price predicton of ACHR Stock?

What is Archer Aviation Inc (ACHR)'s revenue for the last quarter?

What is Archer Aviation Inc (ACHR)'s earnings per share (EPS) for the last quarter?

What changes have occurred in the market's expectations for Archer Aviation Inc (ACHR)'s fundamentals?

How many employees does Archer Aviation Inc (ACHR). have?
