Intellectia LogoIntellectia
Product
Resources
Markets
Pricing
Log inTry for Free
Intellectia Logo
Log in
Intellectia Logo

Product

Features
Financial AI Agent
Stock Technical Analysis
Stock Monitor
Hedge Fund Tracker
Crypto Technical Analysis
AI Screener
Trading Strategies
AI Stock Picker
Swing Trading
Earnings Trading
Stock Chart Patterns
Daytrading Center

Resources

Learn
Blog
Earnings
Tutorial
Help Center
Company
About Us
Contact
Press
Reward Program
Partner Program
Dividend Calculator
Dividend Yield Calculator
Options Profit Calculator
Compare
TradingView
SeekingAlpha

Markets

Trending Stocks
Hot Crypto
Trending News
All Stocks
Pricing
Start for Free
  1. Home
  2. >
  3. Stock
  4. >
  5. TX
stocks logo

TX

-
Add to WatchlistAdvanced Chart
$
0.000
0.000(0.000%)
High
--
Open
--
VWAP
--
Vol
--
Mkt Cap
--
Low
--
Amount
--
EV/EBITDA(TTM)
--
Total Shares
--
EV
--
EV/OCF(TTM)
--
P/S(TTM)
--

Market Estimates

Earnings Estimates
Earnings Estimates
Revenue
YoY Chg
EPS
YoYChg
FY2025Q2
FY2025Q3
FY2025Q4
4.19B
-7.08%
1.130
+302.58%
4.47B
-0.3%
1.448
+805.15%
4.14B
+6.78%
1.258
-399.41%
Estimates Revision
The market is revising Downward the revenue expectations for Ternium S.A. (TX) for FY2025, with the revenue forecasts being adjusted by -1.2% over the past three months. During the same period, the stock price has changed by 28.30%.
Revenue Estimates for FY2025
Revise Downward
down Image
-1.2%
In Past 3 Month
EPS Estimates for FY2025
Revise Upward
up Image
+2.92%
In Past 3 Month
Stock Price
Go Up
up Image
+28.30%
In Past 3 Month
3 Analyst Rating
up Image0
Wall Street analysts forecast TX stock price to rise over the next 12 months. According to Wall Street analysts, the average 1-year price target for TX is 36.67 USD with a low forecast of 22.00 USD and a high forecast of 53.00  USD. However, analyst price targets are subjective and often lag stock prices, so investors should focus on the objective reasons behind analyst rating changes, which better reflect the company's fundamentals.
2 Buy
0 Hold
1 Sell
Moderate Buy
up Image0
Current: 31.600
sliders
Low
22.00
Averages
36.67
High
53.00
up Image0
Current: 31.600
sliders
Low
22.00
Averages
36.67
High
53.00
Goldman Sachs
Thiago Ojea
Strong Buy
Maintains
$39 → $35
2025-04-03
Reason
Goldman Sachs
Thiago Ojea
Price Target
$39 → $35
2025-04-03
Maintains
Strong Buy
Reason
UBS
Caio Greiner
Hold
Initiates
$32
2025-03-12
Reason
UBS
Caio Greiner
Price Target
$32
2025-03-12
Initiates
Hold
Reason
Goldman Sachs
Thiago Ojea
Strong Buy
Maintains
$45 → $39
2025-02-06
Reason
Goldman Sachs
Thiago Ojea
Price Target
$45 → $39
2025-02-06
Maintains
Strong Buy
Reason
See All Ratings

Valuation Metrics

The current forward P/E ratio for Ternium SA (TX.N) is 5.91, compared to its 5-year average forward P/E of 5.72. For a more detailed relative valuation and DCF analysis to assess Ternium SA 's fair value, click here.
    Forward PE
    Forward EV/EBITDA
    Forward PS

Forward PE

The forward P/E ratio is a valuation metric that divides a company's current stock price by its estimated future earnings per share over the next 12 months.
StronglyUndervaluedUndervaluedFairOvervaluedStronglyOvervalueddotted line Image
Fair
5Y Average PE
5.72
Current PE
5.91
Overvalued PE
8.04
Undervalued PE
3.39

Forward EV/EBITDA

The forward EV/EBITDA ratio is a valuation metric that divides a company's enterprise value (EV) by its estimated future earnings before interest, taxes, depreciation, and amortization (EBITDA) over the next 12 months.
StronglyUndervaluedUndervaluedFairOvervaluedStronglyOvervalueddotted line Image
Overvalued
5Y Average EV/EBITDA
3.25
Current EV/EBITDA
4.65
Overvalued EV/EBITDA
4.17
Undervalued EV/EBITDA
2.33

Forward PS

The forward P/S ratio is a valuation metric that divides a company's current stock price by its estimated future sales (or revenue) per share over the next 12 months.
StronglyUndervaluedUndervaluedFairOvervaluedStronglyOvervalueddotted line Image
Fair
5Y Average PS
0.45
Current PS
0.37
Overvalued PS
0.53
Undervalued PS
0.36

Financials

Annual
Quarterly
N/A
Total Revenue
N/A
Operating Profit
N/A
Net Income after Tax
N/A
EPS - Diluted
N/A
Free Cash Flow
N/A
Gross Profit Margin - %
N/A
FCF Margin - %
N/A
Net Margin - %
N/A
ROIC

Trading Trends

    Insider
    Hedge Fund
    Congress Trading
Insider
Insiders are Neutral. There are no significant trading trends over the last month.
Sold
Bought
Hedge Fund
Hedge Funds are Neutral. There are no significant trading trends over the last quarter.
Sold
Bought
Congress Trading
Congress are Neutral. There are no significant trading trends over the last month.
Sold
Bought
Insider
Insiders are Neutral. There are no significant trading trends over the last month.
Sold
Bought

TX News & Events

Events Timeline

Sign Up For More Events
No Data
Sign Up For More Events

News

Preview
2.0
07-03NASDAQ.COM
TX Makes Bullish Cross Above Critical Moving Average
  • Stock Performance Overview: TX's stock has a 52-week low of $24 per share and a high of $38.40, with the last trade recorded at $31.91.

  • Market Insights Disclaimer: The opinions expressed in the article are those of the author and do not necessarily represent Nasdaq, Inc.

Preview
9.5
05-01Newsfilter
Tenaris Announces 2025 First Quarter Results
  • Financial Performance Overview: Tenaris S.A. reported a net sales increase of 3% in Q1 2025 compared to Q4 2024, but a 15% decrease compared to Q1 2024, with EBITDA at $696 million and a free cash flow of $647 million, reflecting stable operations despite declining average selling prices.

  • Market Outlook: The oil and gas drilling activity remains stable, though expectations for oil demand have shifted due to economic growth concerns and OPEC+ production increases; Tenaris anticipates a slight sales increase in Q2 2025 as average selling prices recover.

Preview
9.5
04-07Benzinga
Why Chanson International Holding Shares Are Trading Higher By Around 170%; Here Are 20 Stocks Moving Premarket
  • Chanson International Holding's Financial Performance: Shares of Chanson International Holding surged 170% in pre-market trading after reporting a year-over-year increase in FY24 financial results, with EPS rising to 5 cents and revenue increasing to $18.2 million.

  • Market Movements of Other Stocks: Several stocks experienced significant pre-market trading movements, including Bluejay Diagnostics rising 69.5%, while BrightSpring Health Services fell 35.8%.

Sign Up For More News

People Also Watch

FAQ

arrow icon

What is Ternium SA (TX) stock price today?

The current price of TX is 31.6 USD — it has decreased -1.5 % in the last trading day.

arrow icon

What is Ternium SA (TX)'s business?

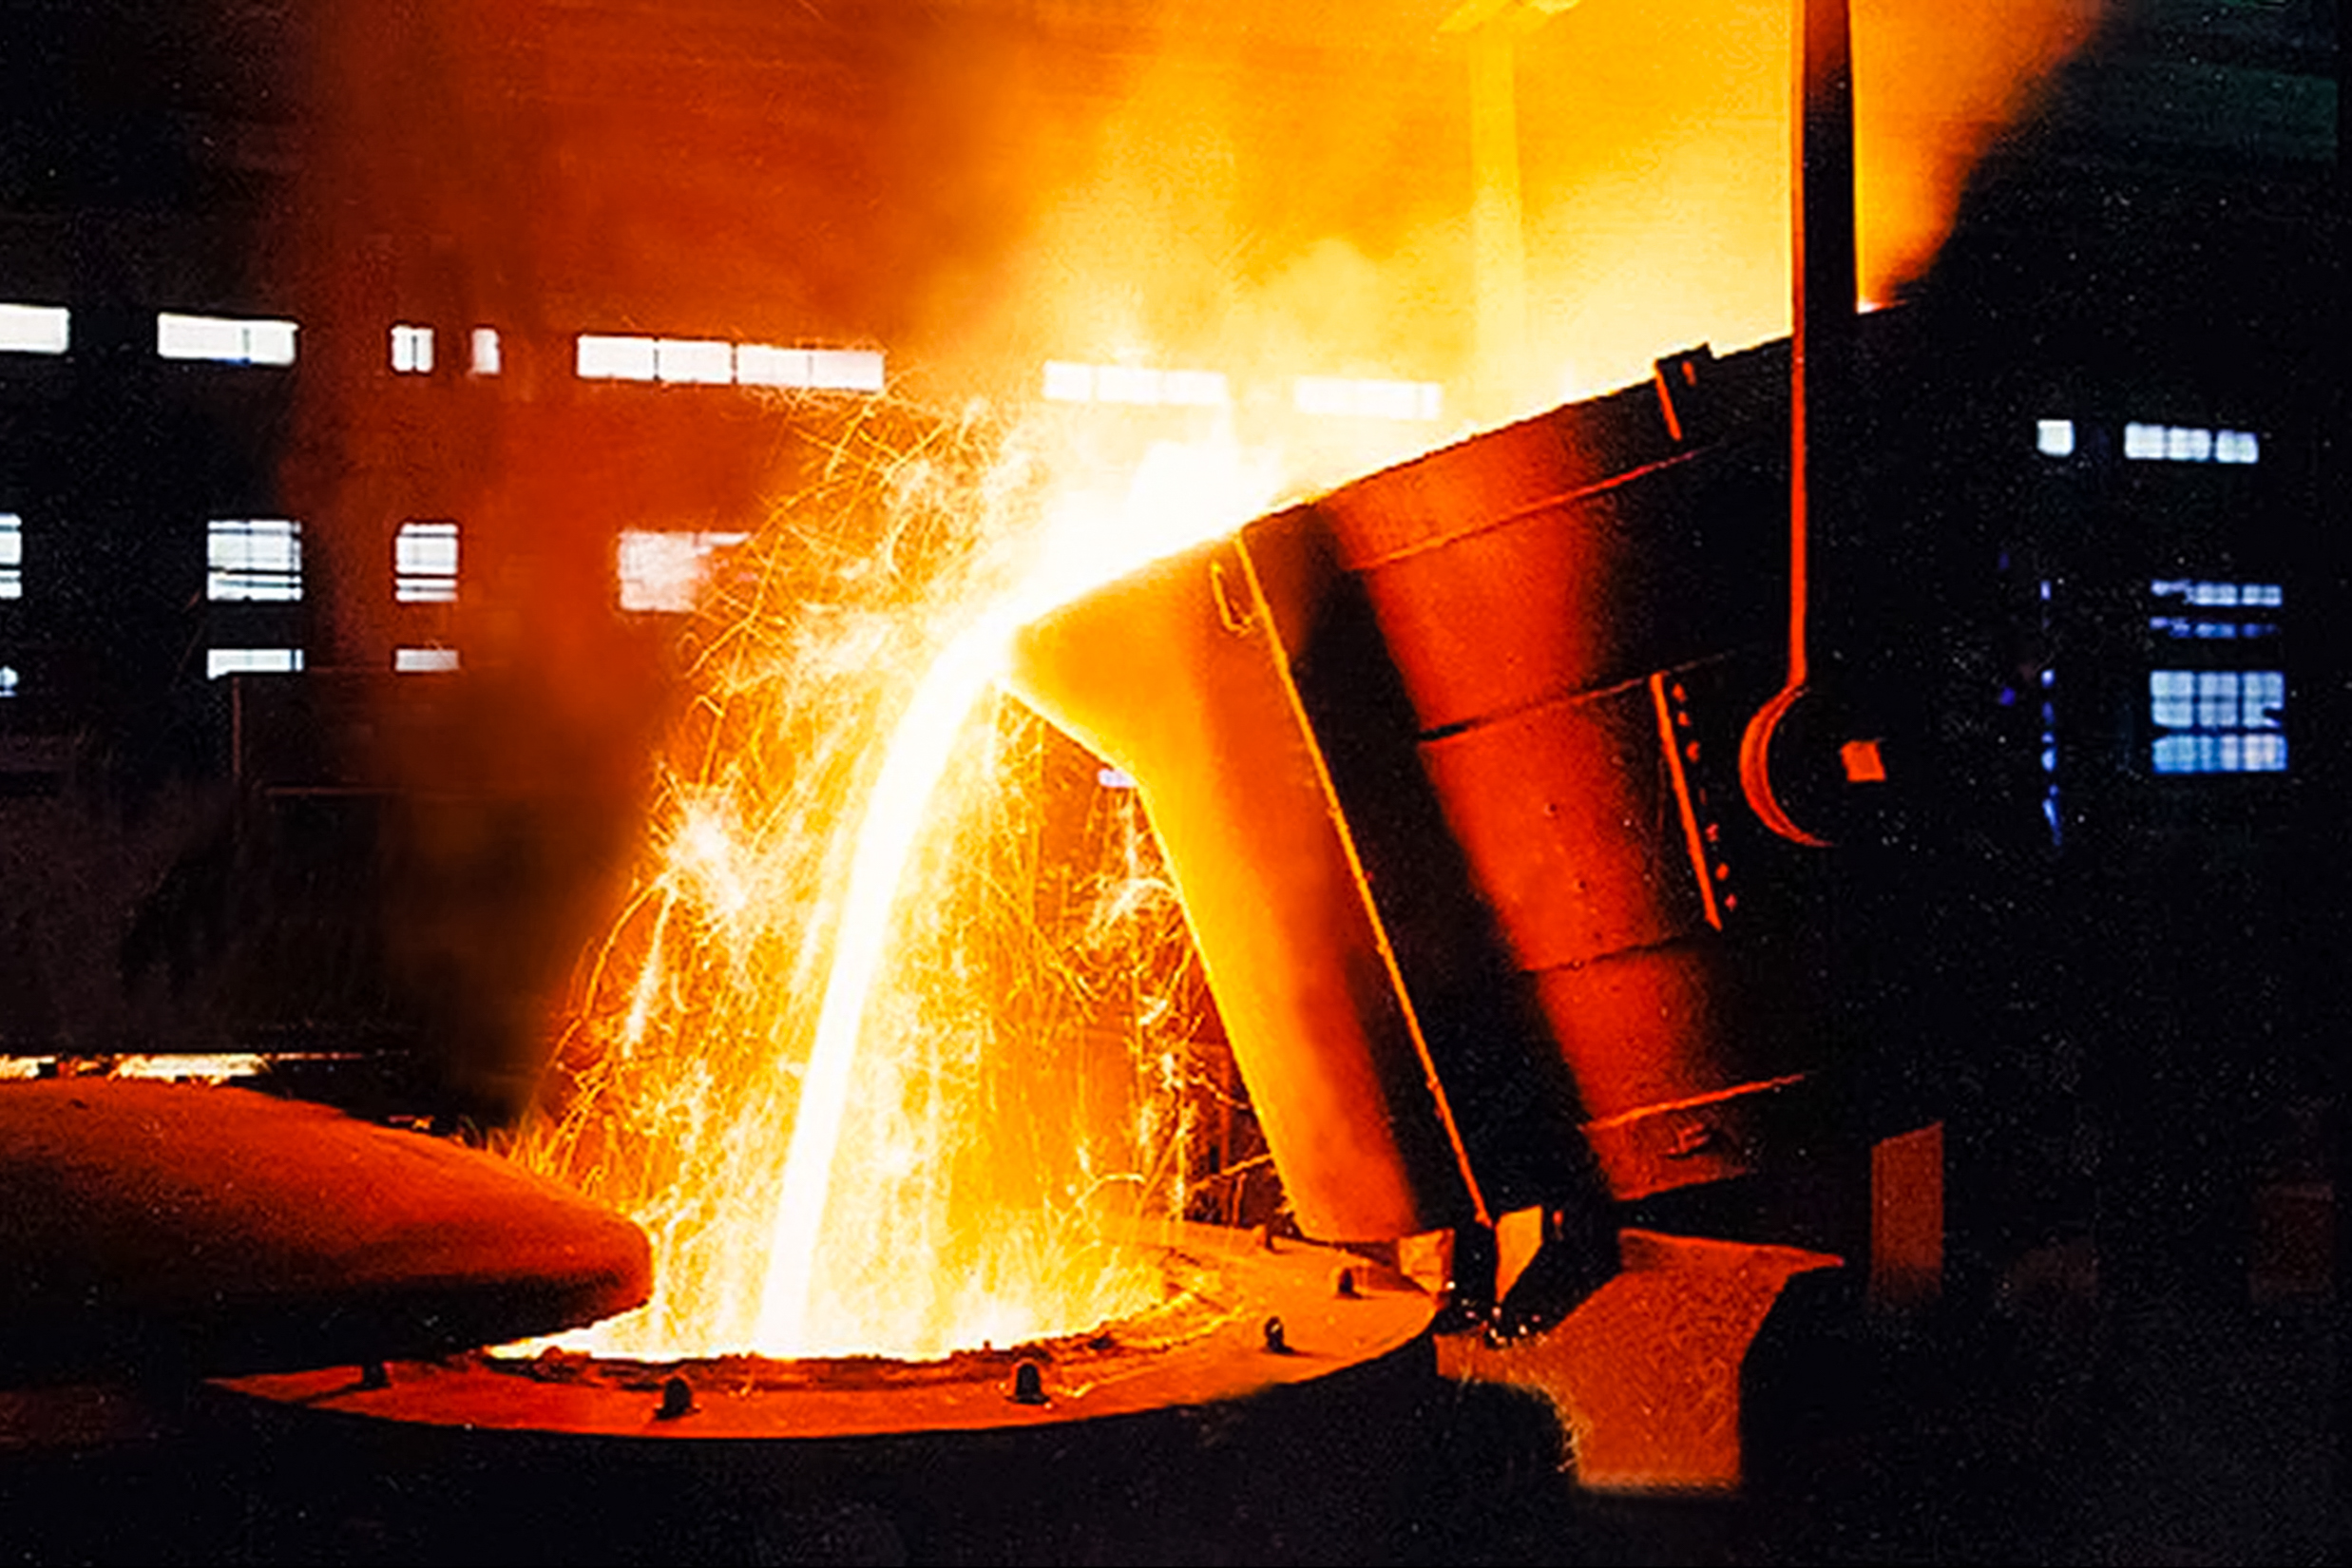
Ternium S.A. is a producer of steel products. The Company produces finished and semi-finished steel products and iron ore, which are sold either directly to steel manufacturers, steel processors or end users. The Company operates through two segments: Steel and Mining. The Steel segment includes the sales of steel products, and the Mining segment includes the sales of iron ore products, which are primarily inter-company. The Steel segment comprises three operating segments: Mexico, the Southern Region, and Other Markets. In the steel segment, steel products include slabs, billets, and round bars (steel in its basic, semi-finished state), hot-rolled coils and sheets, bars and stirrups, wire rods, cold-rolled coils and sheets, tin plate, hot dipped galvanized and electrogalvanized sheets and pre-painted sheets, steel pipes and tubular products, beams, roll-formed products, and other products. In the mining segment, iron ore is sold as concentrates (fines) and pellets.

arrow icon

What is the price predicton of TX Stock?

Wall Street analysts forecast TX stock price to rise over the next 12 months. According to Wall Street analysts, the average 1-year price target for TX is 36.67 USD with a low forecast of 22.00 USD and a high forecast of 53.00 USD. However, analyst price targets are subjective and often lag stock prices, so investors should focus on the objective reasons behind analyst rating changes, which better reflect the company's fundamentals.

arrow icon

What is Ternium SA (TX)'s revenue for the last quarter?

Ternium SA revenue for the last quarter amounts to 3.93B USD, decreased -17.69 % YoY.

arrow icon

What is Ternium SA (TX)'s earnings per share (EPS) for the last quarter?

Ternium SA. EPS for the last quarter amounts to 0.03 USD, decreased -83.33 % YoY.

arrow icon

What changes have occurred in the market's expectations for Ternium SA (TX)'s fundamentals?

The market is revising Downward the revenue expectations for Ternium S.A. (TX) for FY2025, with the revenue forecasts being adjusted by -1.2% over the past three months. During the same period, the stock price has changed by 28.30%.
arrow icon

How many employees does Ternium SA (TX). have?

Ternium SA (TX) has 34458 emplpoyees as of July 08 2025.

arrow icon

What is Ternium SA (TX) market cap?

Today TX has the market capitalization of 6.33B USD.

Intellectia LogoIntellectiaIntellectia LogoIntellectia

Redefine Your Investment Decisions

TwitterTwitterYoutubeYoutubeQuoraQuoraDiscordDiscordLinkedinLinkedinTelegramTelegram

Copyright © 2025 Intellectia.AI. All Rights Reserved.

pci certified logo
Company
HomeContactAbout UsNews Release
Compare
TradingViewSeeking Alpha
Features
Financial AI AgentStock Technical AnalysisStock MonitorHedge Fund TrackerCrypto Technical AnalysisAI ScreenerDaytrading Center
Strategies
AI Stock PickerSwing TradingStock Chart PatternsEarnings Trading
Free Tools
Dividend CalculatorDividend Yield CalculatorOptions Profit Calculator
Resource
BlogTutorialEarningsTrending StocksCrypto MarketPartner ProgramTerms of UsePrivacy PolicySitemap
Start for Free