Intellectia LogoIntellectia
Product
Resources
Markets
News
Partner Program
Pricing
Log inTry for Free
Intellectia Logo
Log in
Intellectia Logo

Product

Features
Financial AI Agent
Stock Technical Analysis
Stock Monitor
Hedge Fund Tracker
AI Screener
Trading Strategies
AI Stock Picker
Swing Trading
Quant AI
Stock Chart Patterns
Daytrading Center
AI Earnings Prediction
Whales Auto Tracker
Backtesting Playground

Resources

Learn
Blog
Earnings
Tutorial
Help Center
Company
About Us
Contact
Press
Reward Program
Partner Program
Tools
Dividend Calculator
Dividend Yield Calculator
Options Profit Calculator
Compare
TradingView
SeekingAlpha

Markets

Trending Stocks
Hot Crypto
Trending News
All Stocks

News

Trading News
Overview
Top News
Daily Market Brief
Earnings
Latest
Newswire
Stock News
Crypto News
Monitor News
Partner ProgramPricing
Start for Free
  1. Home
  2. >
  3. Stock
  4. >
  5. SIDU
stocks logo

SIDU

-
collectAdd to Watchlistadvanced chartAdvanced Chart
$
0.000
0(0.000%)1D
collectadvanced chart
    Overview
    Forecast
    Valuation
    Earnings
High
--
Open
--
VWAP
--
Vol
--
Mkt Cap
--
Low
--
Amount
--
EV/EBITDA(TTM)
--
Total Shares
--
EV
--
EV/OCF(TTM)
--
P/S(TTM)
--
Intellectia AI SwingMax

Valuation Metrics

The current forward P/E ratio for Sidus Space Inc (SIDU.O) is -1.04, compared to its 5-year average forward P/E of -2.86. For a more detailed relative valuation and DCF analysis to assess Sidus Space Inc 's fair value, click here.
  • Forward PE
  • Forward EV/EBITDA
  • Forward PS

Forward PE

The forward P/E ratio is a valuation metric that divides a company's current stock price by its estimated future earnings per share over the next 12 months.
StronglyUndervaluedUndervaluedFairOvervaluedStronglyOvervalueddotted line Image
N/A
5Y Average PE
-2.86
Current PE
-1.04
Overvalued PE
0.18
Undervalued PE
-5.90

Forward EV/EBITDA

The forward EV/EBITDA ratio is a valuation metric that divides a company's enterprise value (EV) by its estimated future earnings before interest, taxes, depreciation, and amortization (EBITDA) over the next 12 months.
StronglyUndervaluedUndervaluedFairOvervaluedStronglyOvervalueddotted line Image
N/A
5Y Average EV/EBITDA
0.00
Current EV/EBITDA
0.00
Overvalued EV/EBITDA
0.00
Undervalued EV/EBITDA
0.00

Forward PS

The forward P/S ratio is a valuation metric that divides a company's current stock price by its estimated future sales (or revenue) per share over the next 12 months.
StronglyUndervaluedUndervaluedFairOvervaluedStronglyOvervalueddotted line Image
N/A
5Y Average PS
3.77
Current PS
0.00
Overvalued PS
8.89
Undervalued PS
-1.35
Financial AI Agent
Financial AI Agent

Financials

Annual
Quarterly
N/A
Total Revenue
N/A
Operating Profit
N/A
Net Income after Tax
N/A
EPS - Diluted
N/A
Free Cash Flow
N/A
Gross Profit Margin - %
N/A
FCF Margin - %
N/A
Net Margin - %

Trading Trends

  • Insider
  • Hedge Fund
  • Congress Trading
Insider
Insiders are Neutral. There are no significant trading trends over the last month.
Sold
Bought
Hedge Fund
Hedge Funds are Neutral. There are no significant trading trends over the last quarter.
Sold
Bought
Congress Trading
Congress are Neutral. There are no significant trading trends over the last month.
Sold
Bought
Insider
Insiders are Neutral. There are no significant trading trends over the last month.
Sold
Bought
AI Stock Picker
AI Stock Picker

SIDU News & Events

Events Timeline

(ET)
2025-12-04
09:20:00
Sidus Space Supports MobLobSpace with $173K NASA Contract
select
2025-11-04 (ET)
2025-11-04
09:23:34
Sidus Space Finalizes Design Stage for FeatherEdge 248Vi Edge Computer
select
2025-10-27 (ET)
2025-10-27
08:58:41
Sidus Space Completes Agreement for Commercial Pathfinder Mission with Lonestar
select
Sign Up For More Events

News

[object Object]
Preview
9.5
11-15Benzinga
Earnings Update for Space Stocks: Firefly, Rocket Lab, AST, and Others
  • Rocket Lab Performance: Rocket Lab reported Q3 revenue of $155.05 million, exceeding estimates, and a loss of three cents per share, which was better than the expected loss of 11 cents.

  • AST SpaceMobile Results: AST SpaceMobile reported a loss of 45 cents per share, missing analyst expectations, with revenue of $14.73 million, also below estimates, but reaffirmed its revenue guidance for the second half of 2025.

  • Virgin Galactic Update: Virgin Galactic's Q3 revenue remained flat at $365,000 with a loss of $1.09 per share; the company announced plans for its Flight Test Program to start in Q3 2026 and commercial flights in Q4 2026.

  • Firefly Aerospace Growth: Firefly Aerospace reported Q3 revenue of $30.78 million, surpassing estimates, and a loss of 33 cents per share, better than expected; the company raised its full-year 2025 revenue guidance to between $150 million and $158 million.

[object Object]
Preview
4.5
11-15SeekingAlpha
Sidus Space Plans LizzieSat-4 and LizzieSat-5 Launches for Late 2026 and Expands Product Commercialization Across All Domains
  • Management Insights: CEO Carol Craig highlighted Sidus Space's focus on vertical integration, the advancement of the LizzieSat constellation, and a strategic shift towards diversified, recurring revenue models, with significant progress on the mobile launch 2 contract.

  • Financial Performance: For the first nine months of 2025, total revenue was approximately $2.8 million, down from $3.8 million in 2024, with a reported net loss of $6 million for Q3 2025, attributed to a transition away from legacy contracts towards higher-value commercial solutions.

  • Future Outlook: The company plans to launch two additional LizzieSat spacecraft by late 2026 and expects revenue contributions from the Fortis VPX computing suite starting in 2026, aiming for improved gross margins and revenue visibility.

  • Risks and Strategic Focus: CFO Adarsh Parekh noted challenges from global supply chain pressures and uncertainties in government funding, while management emphasized a diversified revenue model and plans for cost reductions to support long-term profitability.

[object Object]
Preview
9.5
11-15SeekingAlpha
Sidus Space Reports GAAP EPS of -$0.24 and Revenue of $1.3 Million
  • Q3 Financial Performance: Sidus Space reported a Q3 GAAP EPS of -$0.24 and a revenue of $1.3 million, reflecting a 31.6% year-over-year decline.

  • Contract Award: The company has been awarded a five-year IDIQ contract for the Tobyhanna Army Depot.

  • Public Offering Announcement: Sidus Space has announced the pricing of a public offering.

  • Seeking Alpha Rating: The company has received a Quant Rating from Seeking Alpha, along with historical earnings data and financial information.

Sign Up For More News

People Also Watch

FAQ

arrow icon

What is Sidus Space Inc (SIDU) stock price today?

The current price of SIDU is 0.8062 USD — it has increased 4.81 % in the last trading day.

arrow icon

What is Sidus Space Inc (SIDU)'s business?

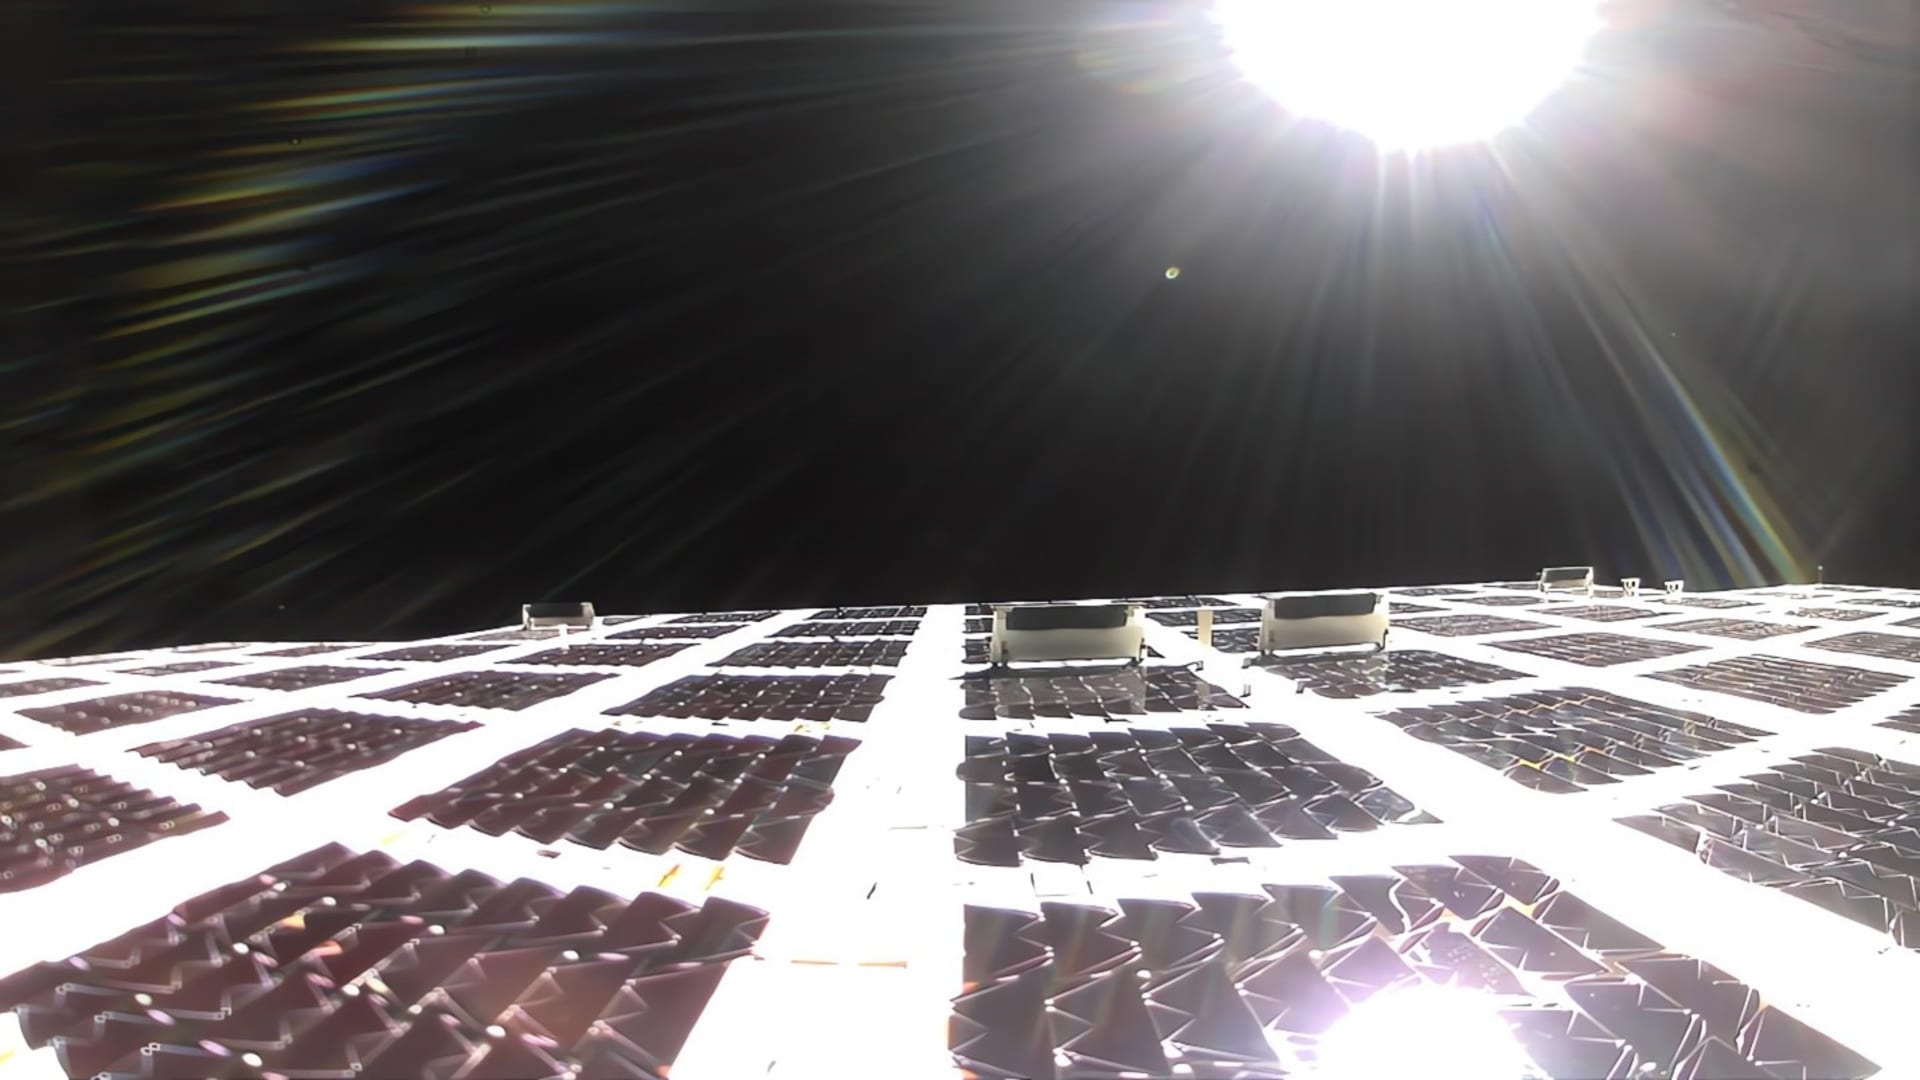
Sidus Space, Inc. is a space mission enabler providing solutions, including custom satellite design, payload hosting, mission management, artificial intelligence (AI)-enhanced space-based sensor data-as-a-service and space manufacturing. Its flight modular satellite, LizzieSat is a 3D printed, multi-sensor, multi-mission satellite, offering a platform that can be adapted to integrate new technologies or customized and scaled to create a new satellite design to meet mission requirements. It also offers fully customized satellite design services for any mission in Leo, Geo, Cislunar or Lunar. It offers AI-enhanced Data-as-a-Service, utilizing the Orlaith AI ecosystem, which includes its FeatherEdge AI processor and Cielo AI solutions from space, on the LizzieSat platform to deliver data insights from space. Its 3D printing capabilities include functional prototypes and models, and production parts. It serves government, defense, intelligence and commercial companies around the globe.

arrow icon

What is the price predicton of SIDU Stock?

Wall Street analysts forecast SIDU stock price to fall over the next 12 months. According to Wall Street analysts, the average 1-year price target for SIDU is  USD with a low forecast of USD and a high forecast of USD. However, analyst price targets are subjective and often lag stock prices, so investors should focus on the objective reasons behind analyst rating changes, which better reflect the company's fundamentals.

arrow icon

What is Sidus Space Inc (SIDU)'s revenue for the last quarter?

Sidus Space Inc revenue for the last quarter amounts to 1.30M USD, decreased -30.55 % YoY.

arrow icon

What is Sidus Space Inc (SIDU)'s earnings per share (EPS) for the last quarter?

Sidus Space Inc. EPS for the last quarter amounts to -0.24 USD, decreased -74.19 % YoY.

arrow icon

What changes have occurred in the market's expectations for Sidus Space Inc (SIDU)'s fundamentals?

The market is revising No Change the revenue expectations for Sidus Space, Inc. (SIDU) for FY2025, with the revenue forecasts being adjusted by 0% over the past three months. During the same period, the stock price has changed by -32.25%.
arrow icon

How many employees does Sidus Space Inc (SIDU). have?

Sidus Space Inc (SIDU) has 104 emplpoyees as of December 05 2025.

arrow icon

What is Sidus Space Inc (SIDU) market cap?

Today SIDU has the market capitalization of 28.37M USD.

Intellectia LogoIntellectiaIntellectia LogoIntellectia

Redefine Your Investment Decisions

TwitterTwitterYoutubeYoutubeQuoraQuoraDiscordDiscordLinkedinLinkedinTelegramTelegram
AppStoreGooglePlay

Copyright © 2025 Intellectia.AI. All Rights Reserved.

pci certified logo
Company
HomeContactAbout UsNews Release
Compare
TradingViewSeeking Alpha
Features
Financial AI AgentStock Technical AnalysisStock MonitorHedge Fund TrackerAI ScreenerDaytrading Center
Strategies
AI Stock PickerSwing TradingStock Chart PatternsEarnings TradingDaytrading CenterAI Earnings PredictionQuant AIWhales Auto TrackerBacktesting Playground
Free Tools
Dividend CalculatorDividend Yield CalculatorOptions Profit Calculator
Resource
BlogTutorialEarningsTrending StocksCrypto MarketPartner ProgramTerms of UsePrivacy PolicySecuritySitemap
Start for Free