Loading...

Intellectia LogoIntellectia
AI Trading Bot
Features
Markets
News
Resources
Pricing
Get Started
  1. Home
  2. Stock
  3. MGY
MGY logo

MGY Overview

-
$
0.000
0.000(0.000%)
At close
0.000(0.000%)Aft-market
ET
$
0.000
0.000(0.000%)
At close
0.000(0.000%)Aft-market
ET
OverviewStock Price PredictionTechnicalValuationFinancialsEarningsShould I BuyNews & Events
an image of Intellectia Logoan image of Intellectia

Most Trusted AI Platform for Winning Trades

TwitterYoutubeQuoraDiscordLinkedinTelegram

Copyright © 2026 Intellectia.AI. All Rights Reserved.

Company

  • Home
  • Contact
  • About Us
  • Press
  • Privacy
  • Terms of Service
  • Service Terms of Use

Resources

  • Blog
  • Tutorial
  • Help Center
  • Affiliate Program

Markets

  • Market Analysis
  • Crypto
  • Featured Screeners
  • AI Earnings Calendar
  • Market Movers
  • Stock Monitor
  • Economic Calendar
  • All US Stocks
  • All Cryptos

Tools

  • Dividend Calculator
  • Dividend Yield Calculator
  • Options Profit Calculator

Features

  • QuantAI Alpha Pick
  • SwingMax Portfolio
  • Swing Trading
  • AI Stock Picker
  • Whales Auto Tracker
  • Daytrading Center
  • Patterns Detection
  • AI Screener
  • Financial AI Agent
  • Backtesting Playground
  • AI Earnings Prediction
  • Stock Monitor
  • Technical Analysis

News

  • Overview
  • Top News
  • Daily Market Brief
  • Earnings Analysis
  • Newswire
  • Stock News
  • Crypto News
  • Institution News
  • Congress News
  • Monitor News

Compare

  • TradingView
  • SeekingAlpha
Intellectia

Loading chart...

High
31.660
Open
31.170
VWAP
31.37
Vol
2.38M
Mkt Cap
5.83B
Low
31.150
Amount
74.55M
EV/EBITDA(TTM)
6.73
Total Shares
186.41M
EV
5.95B
EV/OCF(TTM)
6.77
P/S(TTM)
4.37
Magnolia Oil & Gas Corporation is an oil and gas exploration and production company with operations primarily in South Texas in the core of the Eagle Ford Shale and Austin Chalk formations. The Company’s oil and natural gas properties are located primarily in the Karnes and Giddings areas in South Texas. Its assets consist of a total leasehold position of approximately 817,907 gross (604,057 net) acres, including 79,067 gross (54,936 net) acres in the Karnes area and 738,840 gross (549,121 net) acres in the Giddings area. The Giddings area is comprised of oil and natural gas assets primarily located in Brazos, Burleson, Fayette, Grimes, Lee, Milam, Robertson, and Washington Counties, Texas. The Karnes area is comprised of oil and natural gas assets primarily located in Karnes, Dimmit, Gonzales, and Zavala Counties, Texas, in the core of the Eagle Ford Shale. The acreage comprising the Karnes area also includes the Austin Chalk formation overlying the Eagle Ford Shale.
Show More

Events Timeline

No data

No data

News

moomoo
4.0
03-24moomoo
Truist Securities Begins Coverage of Magnolia Oil & Gas Corp with a Hold Rating and $33 Target Price
  • Company Overview: Magnolia Oil & Gas Corp is involved in the oil and gas sector, focusing on exploration and production activities.

  • Investment Rating: The company has received a "Hold" rating from Truist Securities, indicating a cautious approach to investing in its stock.

  • Target Price: Truist Securities has set a target price of $33 for Magnolia Oil & Gas Corp shares, suggesting potential growth based on market analysis.

  • Market Context: The rating and target price reflect current market conditions and the company's performance within the oil and gas industry.

moomoo
5.0
03-09moomoo
Magnolia Oil & Gas (MGY.US) Officer Plans to Sell $3.51 Million in Common Stock via Form 144
  • Company Announcement: Magnolia Oil & Gas officer Christopher Gintend plans to sell 119.95K shares of its common stock.

  • Market Value: The total market value of the shares being sold is approximately $3.51 million.

moomoo
6.0
03-05moomoo
UBS Increases Target Price for Magnolia Oil & Gas Corp to $35, Up from $29
  • Company Announcement: Magnolia Oil & Gas Corporation has raised its target price significantly.

  • New Target Price: The target price has been increased from $29 to $35.

seekingalpha
9.5
02-07seekingalpha
Magnolia Oil & Gas Reports Strong Q4 2025 Earnings with Record Production
  • Significant Production Growth: In 2025, Magnolia achieved an 11% increase in total company production, with oil production rising by 4% to nearly 40,000 barrels per day, demonstrating the company's strong performance and execution amid product price volatility.
  • Robust Financial Performance: The fourth quarter adjusted net income was approximately $71 million, translating to $0.38 per diluted share, with adjusted EBITDAX at $216 million, reflecting the company's ongoing commitment to capital discipline and shareholder return strategies.
  • Enhanced Shareholder Returns: Magnolia repurchased approximately 8.9 million shares in 2025, reducing its diluted share count by about 4.5%, while also announcing a 10% dividend increase, marking the fifth consecutive year of dividend growth and boosting investor confidence.
  • Optimistic Future Outlook: The company expects drilling completions and facility capital expenditures for 2026 to range between $440 million and $480 million, with a planned production growth of approximately 5%, showcasing its ability to adapt flexibly to market changes despite product price volatility.
seekingalpha
9.5
02-05seekingalpha
Magnolia Oil & Gas Q4 Earnings Beat Expectations
  • Earnings Highlights: Magnolia Oil & Gas reported a Q4 GAAP EPS of $0.37, beating expectations by $0.01, indicating stable profitability, while revenue of $317.62 million, down 2.7% year-over-year, still exceeded forecasts by $3.88 million, showcasing resilience in a challenging market.
  • Capital Expenditure Plans: The company estimates its 2026 drilling and completion capital spending to be between $440 million and $480 million, comparable to last year, which includes a non-operated capital estimate similar to 2025, reflecting a cautious and stable approach to capital allocation.
  • Production Growth Outlook: Magnolia anticipates total production growth of approximately 5% for 2026, aligning with its capital expenditure plans, indicating a commitment to enhancing production efficiency and output in the coming year.
  • Quarterly Spending Peak: Estimated D&C capital spending for Q1 2026 is approximately $125 million, expected to be the highest quarterly rate for the year, with total production estimated at about 102 Mboe/d, despite a 1.5 Mboe/d downtime impact from a winter storm, all of which has been fully restored, demonstrating the company's quick recovery capabilities.
seekingalpha
9.5
02-05seekingalpha
Magnolia Oil & Gas to Announce Q4 Earnings on February 6
  • Earnings Announcement: Magnolia Oil & Gas is set to release its Q4 earnings on February 6 before the market opens, with a consensus EPS estimate of $0.36, reflecting a 10% year-over-year decline, indicating potential profitability pressures in the current oil price environment.
  • Revenue Expectations: The anticipated revenue for Q4 is $313.74 million, down 3.4% year-over-year, suggesting challenges in sales growth amid market volatility and oil price uncertainties.
  • Performance Revision History: Over the past year, MGY has beaten EPS estimates 50% of the time and revenue estimates 75% of the time, indicating some capacity for exceeding expectations, although recent revision trends may impact investor confidence.
  • Revision Trends Analysis: In the last three months, EPS estimates have seen three upward revisions and 13 downward revisions, while revenue estimates have experienced two upward revisions and ten downward revisions, reflecting a cautious market sentiment regarding the company's future performance.
Wall Street analysts forecast MGY stock price to rise
11 Analyst Rating
Wall Street analysts forecast MGY stock price to rise
7 Buy
3 Hold
1 Sell
Moderate Buy
Current: 0.000
sliders
Low
21.00
Averages
26.44
High
31.00
Current: 0.000
sliders
Low
21.00
Averages
26.44
High
31.00
Truist
Hold
initiated
$33
AI Analysis
2026-03-23
New
Reason
Truist
Price Target
$33
AI Analysis
2026-03-23
New
initiated
Hold
Reason
Truist initiated coverage of Magnolia Oil & Gas with a Hold rating and $33 price target. The recent swing gin commodity prices likely benefits Magnolia the most in the firm's coverage given its differentiated growth strategy, low reinvestment rate, and its unhedged position, the analyst tells investors in a research note. However, the firm sees full valuation as the company currently trades at in-line to peers on both an EV/EBIDAX and FCF yield basis.
JPMorgan
Neutral
maintain
$27 -> $32
2026-03-20
New
Reason
JPMorgan
Price Target
$27 -> $32
2026-03-20
New
maintain
Neutral
Reason
JPMorgan raised the firm's price target on Magnolia Oil & Gas to $32 from $27 and keeps a Neutral rating on the shares. The firm says oil market fundamentals "shifted on a dime" due to the Middle East conflict. The war has significantly reduced global productive capacity and "quickly evaporated the risk" of a supply glut in 2026 following the closure of the Strait of Hormuz, the analyst tells investors in a research note. JPMorgan would not be surprised to see a $5-$10 per barrel geopolitical risk premium embedded into the long-end of the oil price curve.
Unlock Full Analyst Thesis, Get the complete breakdown of rating reason for MGY
Unlock Now

Valuation Metrics

The current forward P/E ratio for Magnolia Oil & Gas Corp (MGY.N) is 13.21, compared to its 5-year average forward P/E of 9.66. For a more detailed relative valuation and DCF analysis to assess Magnolia Oil & Gas Corp's fair value, Click here.

Forward PE

The forward P/E ratio is a valuation metric that divides a company's current stock price by its estimated future earnings per share over the next 12 months.
StronglyUndervaluedUndervaluedFairOvervaluedStronglyOvervalueddotted line Image
5Y Average PE
9.66
Current PE
13.21
Overvalued PE
12.62
Undervalued PE
6.71

Forward EV/EBITDA

The forward EV/EBITDA ratio is a valuation metric that divides a company's enterprise value (EV) by its estimated future earnings before interest, taxes, depreciation, and amortization (EBITDA) over the next 12 months.
StronglyUndervaluedUndervaluedFairOvervaluedStronglyOvervalueddotted line Image
5Y Average EV/EBITDA
4.27
Current EV/EBITDA
4.66
Overvalued EV/EBITDA
4.96
Undervalued EV/EBITDA
3.58

Forward PS

The forward P/S ratio is a valuation metric that divides a company's current stock price by its estimated future sales (or revenue) per share over the next 12 months.
StronglyUndervaluedUndervaluedFairOvervaluedStronglyOvervalueddotted line Image
5Y Average PS
3.02
Current PS
3.13
Overvalued PS
3.50
Undervalued PS
2.55

Financials

AI Analysis
Annual
Quarterly

Related Community Screener

what stocks are likely to rise tomorrow
Intellectia · 77 candidates
Rsi Category: moderateRelative Vol: >= 1.10Moving Average Relationship: PriceCrossAboveMA200
Ticker
Name
Market Cap$
top bottom
GDEV logo
GDEV
GDEV Inc
331.78M
PBR.A logo
PBR.A
Petroleo Brasileiro SA Petrobras
81.46B
IMCR logo
IMCR
Immunocore Holdings PLC
1.78B
FNKO logo
FNKO
Funko Inc
211.27M
WM logo
WM
Waste Management Inc
91.25B
KYIV logo
KYIV
Kyivstar Group Ltd
3.00B
find stock with increasing volume
Intellectia · 114 candidates
Market Cap: 500.00M - 5.00BRelative Vol: >= 2
Ticker
Name
Market Cap$
top bottom
PLXS logo
PLXS
Plexus Corp
4.86B
MIRM logo
MIRM
Mirum Pharmaceuticals Inc
4.82B
IEP logo
IEP
Icahn Enterprises LP
4.81B
SFBS logo
SFBS
ServisFirst Bancshares Inc
4.78B
RUSHB logo
RUSHB
Rush Enterprises Inc
4.68B
TCBI logo
TCBI
Texas Capital Bancshares Inc
4.67B
stocks only
Intellectia · 20 candidates
Market Cap: >= 2.00BDividend Yield Ttm: >= 2Beta: ModerateRiskEps 5yr Cagr: >= 15Pe Ttm: 10 - 25
Ticker
Name
Market Cap$
top bottom
NVO logo
NVO
Novo Nordisk A/S
263.42B
MUFG logo
MUFG
Mitsubishi UFJ Financial Group Inc
206.98B
BBVA logo
BBVA
Banco Bilbao Vizcaya Argentaria SA
141.76B
PNC logo
PNC
PNC Financial Services Group Inc
91.17B
AU logo
AU
Anglogold Ashanti PLC
51.18B
RF logo
RF
Regions Financial Corp
25.12B
top market gainers next week
Intellectia · 32 candidates
Market Cap: >= 1000.00MRelative Vol: >= 2Rsi 14: 60 - 70Moving Average Relationship: PriceAboveMA20Week Price Change Pct: >= $0.00
Ticker
Name
Market Cap$
top bottom
PLAB logo
PLAB
Photronics Inc
2.14B
ALM logo
ALM
Almonty Industries Inc
2.60B
DCOM logo
DCOM
Dime Community Bancshares Inc
1.44B
SDRL logo
SDRL
Seadrill Ltd
2.38B
IAG logo
IAG
IAMGOLD Corp
11.42B
BH.A logo
BH.A
Biglari Holdings Inc
1.53B
mid cap. 55 day breakout.
Intellectia · 30 candidates
Market Cap: 2.00B - 10.00BRelative Vol: >= 1.40New High Low: 52w_High, 20_HighBeta: ModerateRiskMonth Price Change Pct: >= $0.00
Ticker
Name
Market Cap$
top bottom
ARE logo
ARE
Alexandria Real Estate Equities Inc
9.97B
UMBF logo
UMBF
UMB Financial Corp
9.60B
AXSM logo
AXSM
Axsome Therapeutics Inc
9.53B
GGB logo
GGB
Gerdau SA
8.43B
DAR logo
DAR
Darling Ingredients Inc
6.58B
UBSI logo
UBSI
United Bankshares Inc
5.96B
stocks bullish for today
Intellectia · 76 candidates
Relative Vol: >= 2Rsi 14: 60 - 70Moving Average Relationship: PriceAboveMA20Week Price Change Pct: >= $2.00Support Resistance Relationship: PriceBreakResistance
Ticker
Name
Market Cap$
top bottom
IBKR logo
IBKR
Interactive Brokers Group Inc
128.56B
WM logo
WM
Waste Management Inc
91.25B
SHG logo
SHG
Shinhan Financial Group Co Ltd
27.59B
UDR logo
UDR
UDR Inc
12.45B
GIL logo
GIL
Gildan Activewear Inc
12.27B
IAG logo
IAG
IAMGOLD Corp
11.42B

Whales Holding MGY

H
Hite Hedge Asset Management LLC
Holding
MGY
+12.96%
3M Return
S
Systematic Financial Management LP
Holding
MGY
+11.28%
3M Return
H
Heartland Advisors, Inc.
Holding
MGY
+7.91%
3M Return
G
GW&K Investment Management, LLC
Holding
MGY
+3.64%
3M Return
S
Silvercrest Asset Management Group LLC
Holding
MGY
-3.27%
3M Return

Trading Trends

    Insider
    Hedge Fund
    Congress Trading

People Also Watch

Frequently Asked Questions

What is Magnolia Oil & Gas Corp (MGY) stock price today?

The current price of MGY is 31.29 USD — it has increased 1.2

What is Magnolia Oil & Gas Corp (MGY)'s business?

Magnolia Oil & Gas Corporation is an oil and gas exploration and production company with operations primarily in South Texas in the core of the Eagle Ford Shale and Austin Chalk formations. The Company’s oil and natural gas properties are located primarily in the Karnes and Giddings areas in South Texas. Its assets consist of a total leasehold position of approximately 817,907 gross (604,057 net) acres, including 79,067 gross (54,936 net) acres in the Karnes area and 738,840 gross (549,121 net) acres in the Giddings area. The Giddings area is comprised of oil and natural gas assets primarily located in Brazos, Burleson, Fayette, Grimes, Lee, Milam, Robertson, and Washington Counties, Texas. The Karnes area is comprised of oil and natural gas assets primarily located in Karnes, Dimmit, Gonzales, and Zavala Counties, Texas, in the core of the Eagle Ford Shale. The acreage comprising the Karnes area also includes the Austin Chalk formation overlying the Eagle Ford Shale.

What is the price predicton of MGY Stock?

Wall Street analysts forecast MGY stock price to rise over the next 12 months. According to Wall Street analysts, the average 1-year price target for MGY is26.44 USD with a low forecast of 21.00 USD and a high forecast of 31.00 USD. However, analyst price targets are subjective and often lag stock prices, so investors should focus on the objective reasons behind analyst rating changes, which better reflect the company's fundamentals.

What is Magnolia Oil & Gas Corp (MGY)'s revenue for the last quarter?

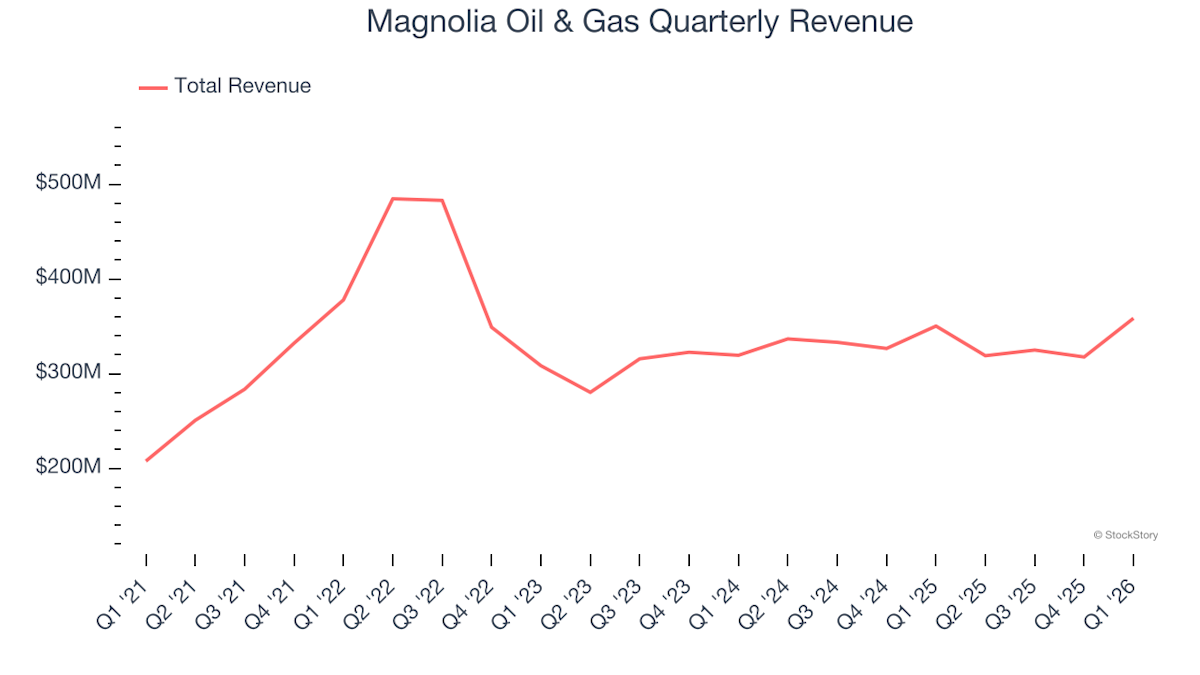
Magnolia Oil & Gas Corp revenue for the last quarter amounts to 317.63M USD, decreased -2.75

What is Magnolia Oil & Gas Corp (MGY)'s earnings per share (EPS) for the last quarter?

Magnolia Oil & Gas Corp. EPS for the last quarter amounts to 0.37 USD, decreased -15.91

How many employees does Magnolia Oil & Gas Corp (MGY). have?

Magnolia Oil & Gas Corp (MGY) has 262 emplpoyees as of March 25 2026.

What is Magnolia Oil & Gas Corp (MGY) market cap?

Today MGY has the market capitalization of 5.83B USD.