CWEN Overview
-
$
0.000
0.000(0.000%)
At close0.000(0.000%)Aft-market
ET
Loading chart...

The current price of CWEN is 37.42 USD — it has increased 1.77
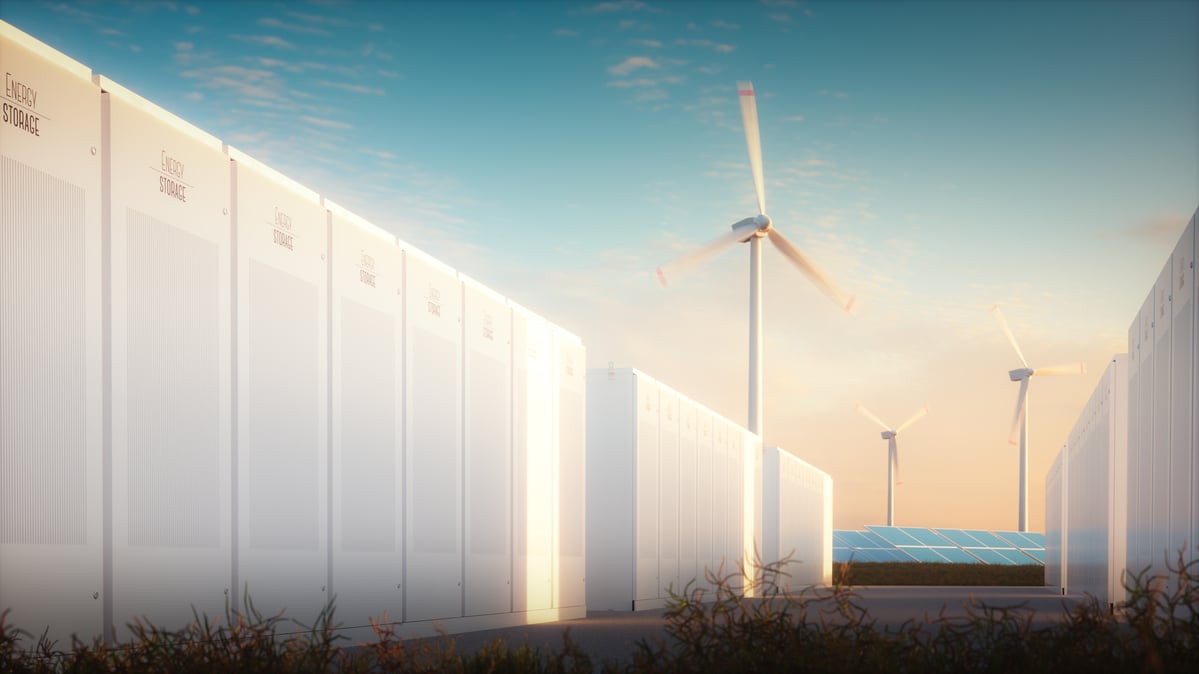
Clearway Energy, Inc. is the owner of clean energy generation assets in the United States. The Company invests in energy infrastructure and focuses on investments in clean energy and owns sustainable and long-term contracted assets across North America. Its portfolio comprises approximately 12.9 gigawatts (GW) of gross capacity in 27 states, including 10.1 GW of wind, solar, and energy storage and over 2.8 GW of dispatchable power generation assets included in the Flexible Generation segment that provides critical grid reliability services. Its operating facilities include Carlsbad, El Segundo, GenConn Devon, GenConn Middletown, Marsh Landing and Walnut Creek. Its utility-scale solar projects include Agua Caliente, Alpine, Avenal, Avra Valley, Blythe, Daggett 3, Desert Sunlight 250, Kansas South, and others. Its wind projects include Alta I, Alta II, Black Rock, Buffalo Bear, Cedro Hill, Crofton Bluffs, Elkhorn Ridge, Lookout, and others.
Wall Street analysts forecast CWEN stock price to rise over the next 12 months. According to Wall Street analysts, the average 1-year price target for CWEN is40.50 USD with a low forecast of 38.00 USD and a high forecast of 50.00 USD. However, analyst price targets are subjective and often lag stock prices, so investors should focus on the objective reasons behind analyst rating changes, which better reflect the company's fundamentals.
Clearway Energy Inc revenue for the last quarter amounts to 354.00M USD, increased 18.79
Clearway Energy Inc. EPS for the last quarter amounts to -1.35 USD, decreased -4600.00
Clearway Energy Inc (CWEN) has 60 emplpoyees as of June 21 2026.
Today CWEN has the market capitalization of 7.68B USD.