$
3.810
-0.06(-1.550%)1D
  • Overview
  • Forecast
  • Valuation
  • Earnings
Line
Line
|
Candle
Candle
1D
5D
1M
3M
6M
YTD
1Y
5Y
High
3.880
Open
3.850
VWAP
3.83
Vol
889.12K
Mkt Cap
7.11B
Low
3.800
Amount
3.41M
EV/EBITDA(TTM)
6.55
Total Shares
465.14M
EV
86.37B
EV/OCF(TTM)
11.57
P/S(TTM)
0.23
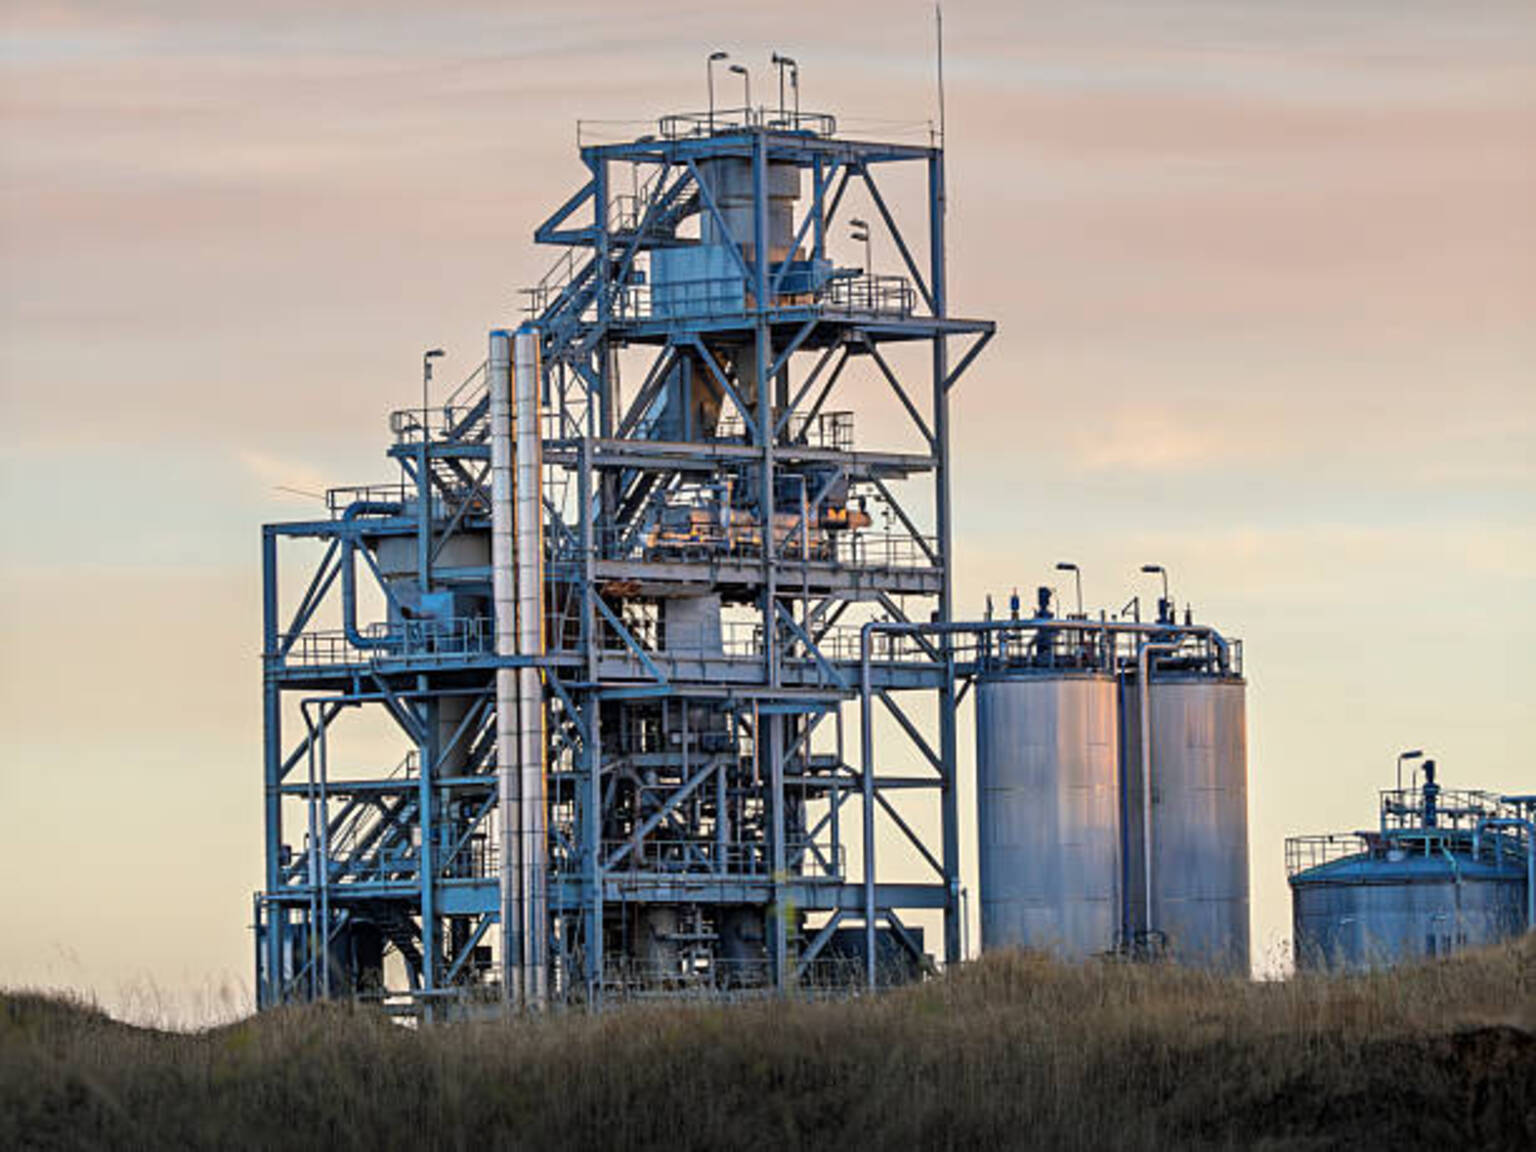
Cosan SA, formerly know as Cosan SA Industria e Comercio, is a Brazil-based company primarily engaged in the oil marketing sector. The Company's activities are divided into six business segments: Raizen Energia, which produces and distributes sugarcane derivatives, such as raw sugar and hydrated ethanol, and cogenerates energy from sugarcane bagasse; Raizen Combustiveis, which distributes fuel, mainly through a network of gasoline stations under the Shell brand name; Comgas, which focuses on the natural gas distribution in the state of Sao Paulo, Brazil; Radar, which is responsible for purchase, sale, management and leasing of agricultural land; Lubricants, which manufactures and sells lubricants under the Mobil brand name in Latin American market, as well as the Comma brand name in the European and Asian market, and Other, which includes investments in other businesses. The Company is a subsidiary of Cosan Ltd.
Show More
Financial AI Agent

Market Estimates

Earnings Estimates
Revenue
YoY Chg
EPS
YoYChg
FY2025Q3
FY2025Q4
FY2026Q1
38.57B
+231.23%
--
--
37.74B
+220.66%
--
--
0.00
-100%
--
--
Estimates Revision
The market is revising Downward the revenue expectations for Cosan S.A. (CSAN) for FY2025, with the revenue forecasts being adjusted by -1.67% over the past three months. During the same period, the stock price has changed by -29.96%.
Revenue Estimates for FY2025
Revise Downward
down Image
-1.67%
In Past 3 Month
EPS Estimates for FY2025
Revise Downward
down Image
-176.81%
In Past 3 Month
Stock Price
Go Down
down Image
-29.96%
In Past 3 Month
1 Analyst Rating
Wall Street analysts forecast CSAN stock price to rise over the next 12 months. According to Wall Street analysts, the average 1-year price target for CSAN is 5.00 USD with a low forecast of 5.00 USD and a high forecast of 5.00 USD. However, analyst price targets are subjective and often lag stock prices, so investors should focus on the objective reasons behind analyst rating changes, which better reflect the company's fundamentals.
1 Buy
0 Hold
0 Sell
Moderate Buy
Current: 3.810
sliders
Low
5.00
Averages
5.00
High
5.00
Citigroup
Gabriel Barra
Strong Buy
Initiates
$19
2024-12-23
Reason
Citi resumed coverage of Cosan (CSAN) with a Buy rating and R$19 price target. The firm's positive view is underpinned by better results at Cosan's business units and by Cosan's focus to deleverage its portfolio during a potential period of higher interest rates in Brazil. According to reports, Cosan is evaluating the sale of its stake at Vale (VALE), and it does not disregard a potential sale of a minority stake in Compass, though this is not a priority, the analyst noted.
See All Ratings

Valuation Metrics

The current forward P/E ratio for Cosan SA (CSAN.N) is 122.73, compared to its 5-year average forward P/E of 12.82. For a more detailed relative valuation and DCF analysis to assess Cosan SA 's fair value, click here.

Forward PE

StronglyUndervaluedUndervaluedFairOvervaluedStronglyOvervalueddotted line Image
N/A
5Y Average PE
12.82
Current PE
122.73
Overvalued PE
51.01
Undervalued PE
-25.37

Forward EV/EBITDA

StronglyUndervaluedUndervaluedFairOvervaluedStronglyOvervalueddotted line Image
Undervalued
5Y Average EV/EBITDA
4.79
Current EV/EBITDA
3.69
Overvalued EV/EBITDA
5.78
Undervalued EV/EBITDA
3.79

Forward PS

StronglyUndervaluedUndervaluedFairOvervaluedStronglyOvervalueddotted line Image
Undervalued
5Y Average PS
0.23
Current PS
0.06
Overvalued PS
0.33
Undervalued PS
0.13
AI Stock Picker

Financials

Annual
Quarterly
FY2025Q2
YoY :
-2.02%
10.48B
Total Revenue
FY2025Q2
YoY :
+2936.35%
2.65B
Operating Profit
FY2025Q2
YoY :
-41.40%
-568.10M
Net Income after Tax
FY2025Q2
YoY :
+325.00%
-0.51
EPS - Diluted
FY2025Q2
YoY :
-28.60%
829.54M
Free Cash Flow
FY2025Q2
YoY :
+3.19%
34.32
Gross Profit Margin - %
FY2025Q2
-3.18
FCF Margin - %
FY2025Q2
YoY :
-40.24%
-5.42
Net Margin - %
FY2025Q2
N/A
ROIC

Trading Trends

Insider
Insiders are Neutral. There are no significant trading trends over the last month.
Sold
0-3
Months
0.0
USD
0
3-6
Months
0.0
USD
0
6-9
Months
0.0
USD
0
0-12
Months
0.0
USD
0
Bought
0-3
0
0.0
USD
Months
3-6
0
0.0
USD
Months
6-9
0
0.0
USD
Months
0-12
0
0.0
USD
Months
Hedge Fund
Hedge Funds are Neutral. There are no significant trading trends over the last quarter.
Sold
0-3
Months
0.0
Volume
0
3-6
Months
0.0
Volume
0
6-9
Months
0.0
Volume
0
0-12
Months
0.0
Volume
0
Bought
0-3
0
0.0
Volume
Months
3-6
0
0.0
Volume
Months
6-9
1
52.6K
Volume
Months
0-12
0
0.0
Volume
Months
Congress Trading
Congress are Neutral. There are no significant trading trends over the last month.
Sold
0-3
Months
0.0
USD
0
3-6
Months
0.0
USD
0
6-9
Months
0.0
USD
0
0-12
Months
0.0
USD
0
Bought
0-3
0
0.0
USD
Months
3-6
0
0.0
USD
Months
6-9
0
0.0
USD
Months
0-12
0
0.0
USD
Months
Intellectia AI SwingMax

CSAN News & Events

Events Timeline

2025-01-21 (ET)
2025-01-21
11:02:05
Cosan falls -8.2%
select
2025-01-21
09:00:11
Cosan falls -7.1%
select
2025-01-21
08:48:52
Cosan falls -7.3%
select
Sign Up For More Events

News

9.5
08-15Newsfilter
Cosan S.A. (CSAN) Q2 2025 Earnings Call Transcript
2.0
07-16NASDAQ.COM
Cosan is Now Oversold (CSAN)
2.0
06-10Benzinga
Insmed, Tesla, Casey's General Stores And Other Big Stocks Moving Higher On Tuesday
Sign Up For More News

FAQ

arrow icon

What is Cosan SA (CSAN) stock price today?

The current price of CSAN is 3.81 USD — it has decreased -1.55 % in the last trading day.

arrow icon

What is Cosan SA (CSAN)'s business?

arrow icon

What is the price predicton of CSAN Stock?

arrow icon

What is Cosan SA (CSAN)'s revenue for the last quarter?

arrow icon

What is Cosan SA (CSAN)'s earnings per share (EPS) for the last quarter?

arrow icon

What changes have occurred in the market's expectations for Cosan SA (CSAN)'s fundamentals?

arrow icon

How many employees does Cosan SA (CSAN). have?

arrow icon

What is Cosan SA (CSAN) market cap?