
BLBD
Blue Bird Corp
- Overview
- Forecast
- Valuation
- Earnings

Line
|

Candle
1D
5D
1M
3M
6M
YTD
1Y
5Y
High
46.380
Open
45.490
VWAP
45.98
Vol
337.14K
Mkt Cap
1.45B
Low
45.420
Amount
15.50M
EV/EBITDA(TTM)
9.61
Total Shares
32.30M
EV
1.42B
EV/OCF(TTM)
12.81
P/S(TTM)
1.13
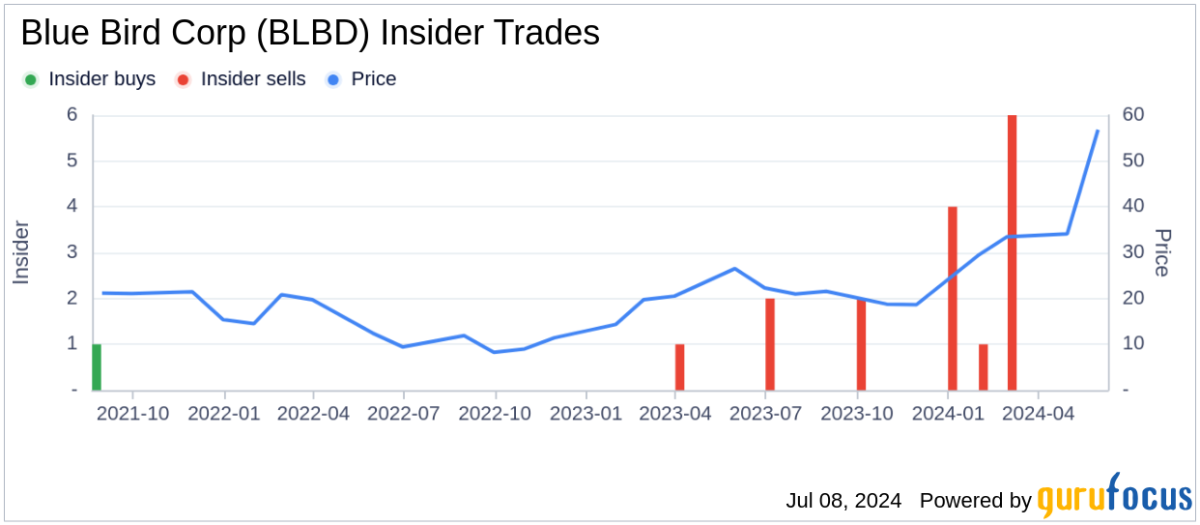
Blue Bird Corporation is an independent designer and manufacturer of school buses. The Company is engaged in designing, engineering, and manufacturing low- and zero-emission school buses with more than 20,000 propane, natural gas, and electric-powered buses. The Bus segment includes the manufacture and assembly of buses to be sold to a variety of customers across the United States, Canada, and in certain limited international markets. The Parts segment consists primarily of the purchase of parts from third parties to be sold to dealers within its network and certain large fleet customers. It designs, engineers, manufactures, and sells three types of buses: Type C school buses, Type D school buses, and specialty buses. Each of its Type C and Type D buses is manufactured and assembled on its own dedicated purpose-built chassis in Fort Valley, Georgia. Its network of dealers and authorized repair centers operate over 200 locations to support the fleet across the United States and Canada.
Show More
Market Estimates
Earnings Estimates
Revenue
YoY Chg
EPS
YoYChg
FY2025Q3
FY2025Q4
FY2026Q1
377.64M
+13.28%
0.985
+8.21%
396.50M
+13.22%
0.969
+25.89%
353.39M
+12.59%
0.925
+0.54%
Estimates Revision
The market is revising Upward the revenue expectations for Blue Bird Corporation (BLBD) for FY2025, with the revenue forecasts being adjusted by 0.51% over the past three months. During the same period, the stock price has changed by 29.35%.
Revenue Estimates for FY2025
Revise Upward

+0.51%
In Past 3 Month
EPS Estimates for FY2025
No Change

0.00%
In Past 3 Month
Stock Price
Go Up

+29.35%
In Past 3 Month
6 Analyst Rating

1.52% Upside
Wall Street analysts forecast BLBD stock price to rise over the next 12 months. According to Wall Street analysts, the average 1-year price target for BLBD is 46.75 USD with a low forecast of 36.00 USD and a high forecast of 52.00 USD. However, analyst price targets are subjective and often lag stock prices, so investors should focus on the objective reasons behind analyst rating changes, which better reflect the company's fundamentals.
5 Buy
1 Hold
0 Sell
Strong Buy

1.52% Upside
Current: 46.050

Low
36.00
Averages
46.75
High
52.00

1.52% Upside
Current: 46.050

Low
36.00
Averages
46.75
High
52.00
Barclays
Adam Seiden
Overweight
maintain
$54 -> $50
2025-05-08
Reason
Barclays
Adam Seiden
Price Target
$54 -> $50
2025-05-08
maintain
Overweight
Reason
DA Davidson
Michael Shlisky
Strong Buy
Maintains
$67 → $61
2025-04-21
Reason
DA Davidson
Michael Shlisky
Price Target
$67 → $61
2025-04-21
Maintains
Strong Buy
Reason
Needham
Chris Pierce
Strong Buy
Maintains
$66 → $49
2025-02-06
Reason
Needham
Chris Pierce
Price Target
$66 → $49
2025-02-06
Maintains
Strong Buy
Reason
Needham
Chris Pierce
Strong Buy
Maintains
$66
2025-01-14
Reason
Needham
Chris Pierce
Price Target
$66
2025-01-14
Maintains
Strong Buy
Reason
Needham
Chris Pierce
Strong Buy
Reiterates
$66
2024-12-13
Reason
Needham
Chris Pierce
Price Target
$66
2024-12-13
Reiterates
Strong Buy
Reason
Needham
Chris Pierce
Strong Buy
Reiterates
$66
2024-11-26
Reason
Needham
Chris Pierce
Price Target
$66
2024-11-26
Reiterates
Strong Buy
Reason
See All Ratings
Valuation Metrics
The current forward P/E ratio for Blue Bird Corp (BLBD.O) is 11.49, compared to its 5-year average forward P/E of 13.13. For a more detailed relative valuation and DCF analysis to assess Blue Bird Corp 's fair value, click here.
Forward PE
The forward P/E ratio is a valuation metric that divides a company's current stock price by its estimated future earnings per share over the next 12 months.

N/A
5Y Average PE
13.13
Current PE
11.49
Overvalued PE
34.62
Undervalued PE
-8.37
Forward EV/EBITDA
The forward EV/EBITDA ratio is a valuation metric that divides a company's enterprise value (EV) by its estimated future earnings before interest, taxes, depreciation, and amortization (EBITDA) over the next 12 months.

N/A
5Y Average EV/EBITDA
17.30
Current EV/EBITDA
6.89
Overvalued EV/EBITDA
39.60
Undervalued EV/EBITDA
-5.00
Forward PS
The forward P/S ratio is a valuation metric that divides a company's current stock price by its estimated future sales (or revenue) per share over the next 12 months.

Overvalued
5Y Average PS
0.69
Current PS
0.96
Overvalued PS
0.92
Undervalued PS
0.45
Financials
Annual
Quarterly
FY2025Q2
YoY :
+3.74%
358.85M
Total Revenue
FY2025Q2
YoY :
-6.53%
33.71M
Operating Profit
FY2025Q2
YoY :
+1.62%
24.47M
Net Income after Tax
FY2025Q2
YoY :
0.00%
0.79
EPS - Diluted
FY2025Q2
YoY :
-63.82%
18.75M
Free Cash Flow
FY2025Q2
YoY :
+7.28%
19.74
Gross Profit Margin - %
FY2025Q2
YoY :
-32.07%
6.44
FCF Margin - %
FY2025Q2
YoY :
-3.46%
7.26
Net Margin - %
FY2025Q2
46.71
ROIC
Trading Trends
Insider
Insiders are Neutral. There are no significant trading trends over the last month.
Sold
0-3
Months
2.0M
USD
4
3-6
Months
108.6K
USD
1
6-9
Months
822.2K
USD
1
0-12
Months
6.6M
USD
9
Bought
0-3
1
15.7K
USD
Months
3-6
1
17.4K
USD
Months
6-9
1
27.4K
USD
Months
0-12
0
0.0
USD
Months
Hedge Fund
Hedge Funds are Neutral. There are no significant trading trends over the last quarter.
Sold
0-3
Months
0.0
Volume
0
3-6
Months
0.0
Volume
0
6-9
Months
118.7K
Volume
2
0-12
Months
0.0
Volume
0
Bought
0-3
0
0.0
Volume
Months
3-6
1
4.7K
Volume
Months
6-9
0
0.0
Volume
Months
0-12
0
0.0
Volume
Months
Congress Trading
Congress are Neutral. There are no significant trading trends over the last month.
Sold
0-3
Months
0.0
USD
0
3-6
Months
16.0K
USD
2
6-9
Months
0.0
USD
0
0-12
Months
0.0
USD
0
Bought
0-3
0
0.0
USD
Months
3-6
0
0.0
USD
Months
6-9
0
0.0
USD
Months
0-12
0
0.0
USD
Months
Insider
Insiders are Neutral. There are no significant trading trends over the last month.
Sold
0-3
Months
2.0M
USD
4
3-6
Months
108.6K
USD
1
6-9
Months
822.2K
USD
1
0-12
Months
6.6M
USD
9
Bought
0-3
1
15.7K
USD
Months
3-6
1
17.4K
USD
Months
6-9
1
27.4K
USD
Months
0-12
0
0.0
USD
Months
BLBD News & Events
Events Timeline
2025-05-07 (ET)
2025-05-07
16:24:22
Blue Bird reports Q2 EPS 96c, consensus 95c

2025-04-23 (ET)
2025-04-23
11:33:50
Electric school bus funds 'flowing' positive for Blue Bird, says Barclays

2025-04-16 (ET)
2025-04-16
13:59:50
Electric school bus shift stalls amid federal funding pause, Bloomberg says

Sign Up For More Events
News
2.0
07-01NASDAQ.COMBlue Bird (BLBD) Ascends While Market Falls: Some Facts to Note
2.0
06-23NASDAQ.COMBlue Bird (BLBD) Surpasses Market Returns: Some Facts Worth Knowing
2.0
06-13NASDAQ.COMWhy Blue Bird (BLBD) Dipped More Than Broader Market Today
Sign Up For More News
People Also Watch

BUSE
First Busey Corp
23.220
USD
-0.47%

PRAX
Praxis Precision Medicines Inc
59.220
USD
+2.09%

ELME
Elme Communities
15.930
USD
-0.56%

EOSE
Eos Energy Enterprises Inc
6.370
USD
+0.16%

FSLY
Fastly Inc
7.160
USD
-0.83%

GRDN
Guardian Pharmacy Services Inc
20.550
USD
+1.33%

PBI
Pitney Bowes Inc
12.280
USD
+1.32%

WLFC
Willis Lease Finance Corp
143.550
USD
+1.62%

MRTN
Marten Transport Ltd
13.000
USD
-0.23%

JBGS
JBG SMITH Properties
19.540
USD
+1.45%
FAQ

What is Blue Bird Corp (BLBD) stock price today?
The current price of BLBD is 46.05 USD — it has increased 1.54 % in the last trading day.

What is Blue Bird Corp (BLBD)'s business?

What is the price predicton of BLBD Stock?

What is Blue Bird Corp (BLBD)'s revenue for the last quarter?

What is Blue Bird Corp (BLBD)'s earnings per share (EPS) for the last quarter?

What changes have occurred in the market's expectations for Blue Bird Corp (BLBD)'s fundamentals?

How many employees does Blue Bird Corp (BLBD). have?
