Analysts Forecast 11% Growth Potential for SUSA
ETF Performance Analysis: The iShares ESG Optimized MSCI USA ETF (SUSA) has an implied analyst target price of $144.73, indicating a potential upside of 10.77% from its current trading price of $130.66.
Notable Holdings with Upside: Key underlying holdings in SUSA include Molina Healthcare Inc (MOH), Cisco Systems Inc (CSCO), and Costco Wholesale Corp (COST), each showing significant upside potential based on analyst target prices.
Analyst Target Comparisons: MOH's average target is $195.36 (16.64% upside), CSCO's is $75.06 (13.38% upside), and COST's is $1092.44 (12.39% upside) compared to their recent trading prices.
Investor Considerations: Questions arise regarding the validity of analysts' targets and whether they reflect realistic expectations or are overly optimistic, necessitating further research by investors.
Trade with 70% Backtested Accuracy
Analyst Views on COST
About COST
About the author


Costco Stock: A Resilient Investment Opportunity
- Significant Performance Growth: Costco's same-store sales surged 13.7% in May, demonstrating its resilience amid economic uncertainties, which is likely to attract further investor interest.
- Stable Membership Base: With 82.9 million paid members, Costco continues to grow its membership despite challenges from inflation and recession, ensuring a stable consumer base for future sales.
- Attractive Market Valuation: Although Costco's P/E ratio stands at 42, its stock price has dipped 3% over the past year, making the current investment opportunity relatively cheaper and appealing to investors seeking safe stocks.
- Sustained Growth Potential: The latest fiscal quarter saw a 9% revenue increase and a 13% rise in net income, with only one year of negative sales growth in over three decades, highlighting Costco's strong growth potential and competitive market position.
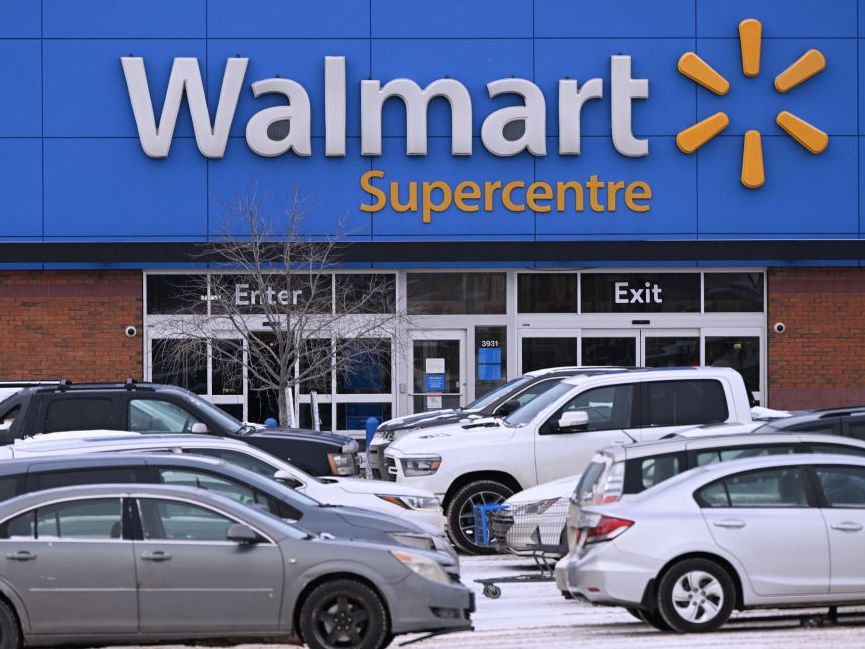
Walmart's Major Price Cuts Spark Competitive Pressure
- Price Cut Implementation: Walmart confirmed broad discounts across its Walmart and Sam's Club stores, including a nearly 15% reduction in ground beef prices, aimed at celebrating the U.S. 250th anniversary, despite persistent inflation, showcasing the company's strategic response to economic pressures.
- Economic Context Impact: The U.S. Consumer Price Index (CPI) rose to 4.2% in May, the highest since April 2023, and Walmart's price cuts not only address consumer concerns over living costs but may also carry significant political weight ahead of the upcoming midterm elections.
- Competitor Response: Walmart's price cuts have put pressure on competitors, with Target's stock sliding over 3%, indicating its limited flexibility in reducing prices on everyday essentials without jeopardizing profitability, highlighting differing financial realities among retailers.
- Market Sentiment Shift: On Stocktwits, retail sentiment around Walmart remained bullish, with message volume surging 1,783% in 24 hours, reflecting investor optimism about the company's future performance, even as its stock has slipped 0.6% year-to-date.

Investment Opportunity Analysis for McCormick
- Attractive McCormick: McCormick's dividend yield is approximately 3.6%, significantly higher than its five-year average P/S ratio of 2x and P/E ratio of 9x, indicating its undervalued investment potential suitable for long-term value investors.
- Market Performance Comparison: Although McCormick's sales have fallen short of Wall Street expectations, it has demonstrated resilience under inflationary pressures, with expectations of growth recovery over the next decade, reflecting its stability as a consumer staples manufacturer.
- Acquisition Risks and Opportunities: McCormick is set to acquire Unilever's food business, which will expand its scale; while this requires increased leverage, its successful integration of other food businesses suggests a favorable risk/reward balance.
- Comparison with Costco: While Costco is an excellent company, its dividend yield of only 0.6% and higher-than-average P/E and P/S ratios indicate an expensive stock price, making it more suitable for growth investors rather than value investors.

Investment Outlook for Walmart and Costco
- Costco's Steady Growth: Costco's comparable sales growth rate exceeded 6% over the past 36 weeks, indicating strong business performance despite low consumer confidence, suggesting it will continue to attract shoppers and maintain market competitiveness.
- Walmart's Growth Potential: Walmart's comparable revenue growth rate in the U.S. is around 4%, and it plans to enhance operations by increasing store count and expanding its advertising business, particularly after acquiring Vizio, which may strengthen its margins and solidify its market position.
- Valuation Appeal: With a price-to-earnings ratio of 39 compared to Costco's 47, Walmart's stock appears more attractive in the current market environment, potentially offering investors higher returns in the long run.
- Market Competition Analysis: While Costco shows good growth momentum, Walmart is better positioned to meet the needs of value-oriented consumers, especially under economic pressure, making its lower valuation an even more compelling investment choice.

Costco vs Walmart: Retail Giants Compete Amid Economic Challenges
- Strong Sales Growth: Costco reported over 6% comparable sales growth in the U.S., Canada, and international markets in its latest earnings report, indicating its ability to attract customers even amid historically low consumer sentiment, enhancing its appeal as a long-term investment.
- Walmart's Stability: Walmart's comparable revenue growth in the U.S. was approximately 4% for the quarter ending April 30, excluding fuel, demonstrating its convenience as a one-stop shop, particularly appealing to cost-conscious consumers amid inflationary pressures.
- Valuation Appeal: With a price-to-earnings ratio of 39, Walmart presents a more attractive valuation compared to Costco's 47, suggesting greater upside potential for Walmart's stock in the long run, especially in the current market environment.
- Market Competition Analysis: While Costco shows strong growth, potential economic pressures could impact spending from higher-income consumers, making Walmart's stable business model and lower valuation a more compelling investment choice.

Rivian's New SUV Challenges Tesla's Market Dominance
- Tesla Sales Figures: In Q2 2023, Tesla produced 451,758 vehicles and delivered 480,126, exceeding the market expectation of 406,600, yet the stock price fell, indicating concerns over its $1.5 trillion valuation.
- Rivian's New Model Launch: Rivian has introduced the mid-market SUV R2, directly targeting the Tesla Model Y, marking a strategic shift from high-end to mid-market, potentially attracting a broader consumer base.
- Shifting Competitive Landscape: With 96.9% of Tesla's sales coming from Model 3/Y, Rivian's previous focus on high-priced R1 models limited its market reach; the R2's launch allows it to compete more effectively in the larger SUV segment.
- Financial Condition Analysis: Rivian currently holds approximately $4.8 billion in cash but is expected to burn through about $9 billion before achieving positive cash flow, suggesting a need for dilutive financing in the future, increasing investor risk.
Costco Stock: A Resilient Investment Opportunity
- Significant Performance Growth: Costco's same-store sales surged 13.7% in May, demonstrating its resilience amid economic uncertainties, which is likely to attract further investor interest.
- Stable Membership Base: With 82.9 million paid members, Costco continues to grow its membership despite challenges from inflation and recession, ensuring a stable consumer base for future sales.
- Attractive Market Valuation: Although Costco's P/E ratio stands at 42, its stock price has dipped 3% over the past year, making the current investment opportunity relatively cheaper and appealing to investors seeking safe stocks.
- Sustained Growth Potential: The latest fiscal quarter saw a 9% revenue increase and a 13% rise in net income, with only one year of negative sales growth in over three decades, highlighting Costco's strong growth potential and competitive market position.
Walmart's Major Price Cuts Spark Competitive Pressure
- Price Cut Implementation: Walmart confirmed broad discounts across its Walmart and Sam's Club stores, including a nearly 15% reduction in ground beef prices, aimed at celebrating the U.S. 250th anniversary, despite persistent inflation, showcasing the company's strategic response to economic pressures.
- Economic Context Impact: The U.S. Consumer Price Index (CPI) rose to 4.2% in May, the highest since April 2023, and Walmart's price cuts not only address consumer concerns over living costs but may also carry significant political weight ahead of the upcoming midterm elections.
- Competitor Response: Walmart's price cuts have put pressure on competitors, with Target's stock sliding over 3%, indicating its limited flexibility in reducing prices on everyday essentials without jeopardizing profitability, highlighting differing financial realities among retailers.
- Market Sentiment Shift: On Stocktwits, retail sentiment around Walmart remained bullish, with message volume surging 1,783% in 24 hours, reflecting investor optimism about the company's future performance, even as its stock has slipped 0.6% year-to-date.
Investment Opportunity Analysis for McCormick
- Attractive McCormick: McCormick's dividend yield is approximately 3.6%, significantly higher than its five-year average P/S ratio of 2x and P/E ratio of 9x, indicating its undervalued investment potential suitable for long-term value investors.
- Market Performance Comparison: Although McCormick's sales have fallen short of Wall Street expectations, it has demonstrated resilience under inflationary pressures, with expectations of growth recovery over the next decade, reflecting its stability as a consumer staples manufacturer.
- Acquisition Risks and Opportunities: McCormick is set to acquire Unilever's food business, which will expand its scale; while this requires increased leverage, its successful integration of other food businesses suggests a favorable risk/reward balance.
- Comparison with Costco: While Costco is an excellent company, its dividend yield of only 0.6% and higher-than-average P/E and P/S ratios indicate an expensive stock price, making it more suitable for growth investors rather than value investors.
Investment Outlook for Walmart and Costco
- Costco's Steady Growth: Costco's comparable sales growth rate exceeded 6% over the past 36 weeks, indicating strong business performance despite low consumer confidence, suggesting it will continue to attract shoppers and maintain market competitiveness.
- Walmart's Growth Potential: Walmart's comparable revenue growth rate in the U.S. is around 4%, and it plans to enhance operations by increasing store count and expanding its advertising business, particularly after acquiring Vizio, which may strengthen its margins and solidify its market position.
- Valuation Appeal: With a price-to-earnings ratio of 39 compared to Costco's 47, Walmart's stock appears more attractive in the current market environment, potentially offering investors higher returns in the long run.
- Market Competition Analysis: While Costco shows good growth momentum, Walmart is better positioned to meet the needs of value-oriented consumers, especially under economic pressure, making its lower valuation an even more compelling investment choice.
Costco vs Walmart: Retail Giants Compete Amid Economic Challenges
- Strong Sales Growth: Costco reported over 6% comparable sales growth in the U.S., Canada, and international markets in its latest earnings report, indicating its ability to attract customers even amid historically low consumer sentiment, enhancing its appeal as a long-term investment.
- Walmart's Stability: Walmart's comparable revenue growth in the U.S. was approximately 4% for the quarter ending April 30, excluding fuel, demonstrating its convenience as a one-stop shop, particularly appealing to cost-conscious consumers amid inflationary pressures.
- Valuation Appeal: With a price-to-earnings ratio of 39, Walmart presents a more attractive valuation compared to Costco's 47, suggesting greater upside potential for Walmart's stock in the long run, especially in the current market environment.
- Market Competition Analysis: While Costco shows strong growth, potential economic pressures could impact spending from higher-income consumers, making Walmart's stable business model and lower valuation a more compelling investment choice.
Rivian's New SUV Challenges Tesla's Market Dominance
- Tesla Sales Figures: In Q2 2023, Tesla produced 451,758 vehicles and delivered 480,126, exceeding the market expectation of 406,600, yet the stock price fell, indicating concerns over its $1.5 trillion valuation.
- Rivian's New Model Launch: Rivian has introduced the mid-market SUV R2, directly targeting the Tesla Model Y, marking a strategic shift from high-end to mid-market, potentially attracting a broader consumer base.
- Shifting Competitive Landscape: With 96.9% of Tesla's sales coming from Model 3/Y, Rivian's previous focus on high-priced R1 models limited its market reach; the R2's launch allows it to compete more effectively in the larger SUV segment.
- Financial Condition Analysis: Rivian currently holds approximately $4.8 billion in cash but is expected to burn through about $9 billion before achieving positive cash flow, suggesting a need for dilutive financing in the future, increasing investor risk.


