Intellectia LogoIntellectia
Product
Resources
Markets
News
Partner Program
Pricing
Log inTry for Free
Intellectia Logo
Log in
Intellectia Logo

Product

Features
Financial AI Agent
Stock Technical Analysis
Stock Monitor
Hedge Fund Tracker
AI Screener
Trading Strategies
AI Stock Picker
Swing Trading
Quant AI
Stock Chart Patterns
Daytrading Center
AI Earnings Prediction
Whales Auto Tracker
Backtesting Playground

Resources

Learn
Blog
Earnings
Tutorial
Help Center
Company
About Us
Contact
Press
Reward Program
Partner Program
Tools
Dividend Calculator
Dividend Yield Calculator
Options Profit Calculator
Compare
TradingView
SeekingAlpha

Markets

Trending Stocks
Hot Crypto
Trending News
All Stocks

News

Trading News
Overview
Top News
Daily Market Brief
Earnings
Latest
Newswire
Stock News
Crypto News
Monitor News
Partner ProgramPricing
Start for Free
  1. Home
  2. >
  3. Stock
  4. >
  5. NEOG
stocks logo

NEOG

-
collectAdd to Watchlistadvanced chartAdvanced Chart
$
0.000
0(0.000%)1D
collectadvanced chart
    Overview
    Forecast
    Valuation
    Earnings
High
--
Open
--
VWAP
--
Vol
--
Mkt Cap
--
Low
--
Amount
--
EV/EBITDA(TTM)
--
Total Shares
--
EV
--
EV/OCF(TTM)
--
P/S(TTM)
--
Financial AI Agent
Financial AI Agent

Market Estimates

Earnings Estimates
Earnings Estimates
Revenue
YoY Chg
EPS
YoYChg
FY2026Q2
FY2026Q3
FY2026Q4
208.51M
-9.84%
0.057
-48.48%
200.80M
-9.13%
0.077
-23.33%
206.86M
-8.25%
0.090
+80%
Estimates Revision
The market is revising Upward the revenue expectations for Neogen Corporation (NEOG) for FY2026, with the revenue forecasts being adjusted by 0.59% over the past three months. During the same period, the stock price has changed by 3.13%.
Revenue Estimates for FY2026
Revise Upward
up Image
+0.59%
In Past 3 Month
EPS Estimates for FY2026
Revise Upward
up Image
+42.86%
In Past 3 Month
Stock Price
Go Up
up Image
+3.13%
In Past 3 Month
Wall Street analysts forecast NEOG stock price to rise over the next 12 months. According to Wall Street analysts, the average 1-year price target for NEOG is 8.17 USD with a low forecast of 6.50 USD and a high forecast of 10.00 USD. However, analyst price targets are subjective and often lag stock prices, so investors should focus on the objective reasons behind analyst rating changes, which better reflect the company's fundamentals.
4 Analyst Rating
Wall Street analysts forecast NEOG stock price to rise over the next 12 months. According to Wall Street analysts, the average 1-year price target for NEOG is 8.17 USD with a low forecast of 6.50 USD and a high forecast of 10.00 USD. However, analyst price targets are subjective and often lag stock prices, so investors should focus on the objective reasons behind analyst rating changes, which better reflect the company's fundamentals.
1 Buy
3 Hold
0 Sell
Hold
Current: 5.930
sliders
Low
6.50
Averages
8.17
High
10.00
Current: 5.930
sliders
Low
6.50
Averages
8.17
High
10.00
Piper Sandler
David Westenberg
Neutral
maintain
$5
2025-10-16
Reason
Piper Sandler
David Westenberg
Price Target
$5
2025-10-16
maintain
Neutral
Reason
Piper Sandler analyst David Westenberg raised the firm's price target on Neogen to $6.50 from $5 following quarterly results. The firm keeps a Neutral rating on the shares.
CJS Securities
initiated
$10
2025-09-29
Reason
CJS Securities
Price Target
$10
2025-09-29
initiated
Reason
CJS Securities initiated coverage of Neogen with a Market Perform rating and $10 price target.
William Blair
Outperform -> Market Perform
downgrade
2025-07-29
Reason
William Blair
Price Target
2025-07-29
downgrade
Outperform -> Market Perform
Reason
William Blair downgraded Neogen to Market Perform from Outperform. The firm had remained bullish because of what it had seen as sales and profitability growth potential, but management pointed to a worsening macro environment that resulted in fiscal 2026 revenue guidance that implies flat to declining revenues. In this context, the firm does not see "a pathway to improving markets, leaving us with tepid fiscal 2026 guidance," the analyst tells investors.
Guggenheim
Buy
downgrade
$13 -> $10
2025-06-30
Reason
Guggenheim
Price Target
$13 -> $10
2025-06-30
downgrade
Buy
Reason
Guggenheim lowered the firm's price target on Neogen to $10 from $13 and keeps a Buy rating on the shares. The firm's updated model includes a pro forma outlook of Neogen assuming current divestiture plans are finalized, as well as management's recent commentary on higher-than-anticipated inventory write-offs, which extends through 2026, the analyst tells investors in a research note.
Piper Sandler
David Westenberg
Hold
Maintains
$6.4 → $5
2025-04-22
Reason
Piper Sandler
David Westenberg
Price Target
$6.4 → $5
2025-04-22
Maintains
Hold
Reason
Piper Sandler analyst David Westenberg lowered the firm's price target on Neogen to $5 from $6.40 and keeps a Neutral rating on the shares. The firm cites a slower ramp in operating margins.
Piper Sandler
David Westenberg
Hold
Maintains
$13 → $6.5
2025-04-14
Reason
Piper Sandler
David Westenberg
Price Target
$13 → $6.5
2025-04-14
Maintains
Hold
Reason
Piper Sandler lowered the firm's price target on Neogen to $6.40 from $13 and keeps a Neutral rating on the shares following quarterly results. The firm cites updated estimates and updated multiple.
See All Ratings

Valuation Metrics

The current forward P/E ratio for Neogen Corp (NEOG.O) is 18.34, compared to its 5-year average forward P/E of 41.00. For a more detailed relative valuation and DCF analysis to assess Neogen Corp 's fair value, click here.
  • Forward PE
  • Forward EV/EBITDA
  • Forward PS

Forward PE

The forward P/E ratio is a valuation metric that divides a company's current stock price by its estimated future earnings per share over the next 12 months.
StronglyUndervaluedUndervaluedFairOvervaluedStronglyOvervalueddotted line Image
Undervalued
5Y Average PE
41.00
Current PE
18.34
Overvalued PE
61.12
Undervalued PE
20.87

Forward EV/EBITDA

The forward EV/EBITDA ratio is a valuation metric that divides a company's enterprise value (EV) by its estimated future earnings before interest, taxes, depreciation, and amortization (EBITDA) over the next 12 months.
StronglyUndervaluedUndervaluedFairOvervaluedStronglyOvervalueddotted line Image
N/A
5Y Average EV/EBITDA
21.55
Current EV/EBITDA
0.00
Overvalued EV/EBITDA
32.57
Undervalued EV/EBITDA
10.53

Forward PS

The forward P/S ratio is a valuation metric that divides a company's current stock price by its estimated future sales (or revenue) per share over the next 12 months.
StronglyUndervaluedUndervaluedFairOvervaluedStronglyOvervalueddotted line Image
N/A
5Y Average PS
4.78
Current PS
0.00
Overvalued PS
7.41
Undervalued PS
2.16
Intellectia AI SwingMax

Financials

Annual
Quarterly
N/A
Total Revenue
N/A
Operating Profit
N/A
Net Income after Tax
N/A
EPS - Diluted
N/A
Free Cash Flow
N/A
Gross Profit Margin - %
N/A
FCF Margin - %
N/A
Net Margin - %
N/A
ROIC

Trading Trends

  • Insider
  • Hedge Fund
  • Congress Trading
Insider
Insiders are Neutral. There are no significant trading trends over the last month.
Sold
Bought
Hedge Fund
Hedge Funds areBuying! The buying amount has increased 999.08% over the last quarter.
Sold
Bought
Congress Trading
Congress are Neutral. There are no significant trading trends over the last month.
Sold
Bought
Insider
Insiders are Neutral. There are no significant trading trends over the last month.
Sold
Bought
AI Stock Picker
AI Stock Picker

NEOG News & Events

Events Timeline

(ET)
2025-10-30
10:00:58
Neogen CFO David Naemura to Leave, Bryan Riggsbee to Take Over
select
2025-10-09 (ET)
2025-10-09
07:11:51
Neogen Supports FY26 Revenue Forecast of $820M-$840M, Aligning with Consensus of $819.1M
select
2025-10-09
07:09:38
Neogen announces Q1 adjusted EPS of 4 cents, matching consensus expectations.
select
Sign Up For More Events

News

[object Object]
Preview
4.5
11-29NASDAQ.COM
Most Active Stocks After Hours on November 28, 2025: HBI, NVDA, SNAP, NEOG, MOS, INTC, AAPL, PFE, QQQ, CCL, AVTR, MSFT
  • NASDAQ 100 After Hours Performance: The NASDAQ 100 After Hours Indicator is down -1.79 to 25,433.1, with a total after-hours volume of 95,876,785 shares traded.

  • Active Stocks Overview: Hanesbrands Inc. (HBI) is up slightly, while NVIDIA Corporation (NVDA) and Snap Inc. (SNAP) are down, with NVDA having positive earnings forecast revisions and SNAP's current price at 80.74% of its target.

  • Stock Price Movements: Other notable stocks include Intel Corporation (INTC) and Apple Inc. (AAPL), with INTC exceeding its target price and AAPL experiencing a slight decline despite positive earnings forecast revisions.

  • Market Recommendations: Several companies, including Microsoft Corporation (MSFT) and Carnival Corporation (CCL), are in the "buy range" according to current market recommendations, with MSFT also showing multiple earnings forecast revisions.

[object Object]
Preview
8.0
11-25NASDAQ.COM
Inaugural Week of NEOG Options Trading for July 2026
  • Put Contract Analysis: The $5.00 put contract for NEOG has a bid of 45 cents, allowing investors to buy shares at $5.00 while effectively lowering their cost basis to $4.55, representing an 18% discount from the current price of $6.11. There is a 73% chance the contract may expire worthless, offering a potential 9.00% return on cash commitment.

  • Call Contract Overview: The $10.00 call contract has a bid of 5 cents, and if shares are purchased at $6.11 and the call is sold, it could yield a 64.48% return if exercised by July 2026. There is a 74% chance this contract may also expire worthless, allowing the investor to retain both shares and premium.

  • Volatility Insights: The implied volatility for the put contract is 72%, while the call contract has an implied volatility of 69%. The actual trailing twelve-month volatility is calculated at 69%, based on the last 250 trading days.

  • YieldBoost Concept: The potential returns from both the put and call contracts are referred to as "YieldBoost," with the put offering a 9.00% return and the call providing a 0.82% boost if it expires worthless. For more options insights, investors can visit StockOptionsChannel.com.

[object Object]
Preview
7.0
11-10Newsfilter
Kuehn Law Urges Neogen Corporation Investors to Reach Out to the Firm
  • Investigation Announcement: Kuehn Law, PLLC is investigating potential breaches of fiduciary duties by officers and directors of Neogen Corporation related to misrepresentations about the 3M integration and its financial impact.

  • Legal Action Details: A federal securities lawsuit claims that Neogen insiders failed to disclose integration issues affecting the company's financial health, prompting the investigation.

  • Call to Action for Shareholders: Shareholders who purchased NEOG shares before January 5, 2023, are encouraged to contact Kuehn Law for potential legal recourse, as there may be limited time to act.

  • Firm's Commitment: Kuehn Law offers to cover all case costs and emphasizes the importance of shareholder participation in maintaining market integrity and fairness.

Sign Up For More News

People Also Watch

FAQ

arrow icon

What is Neogen Corp (NEOG) stock price today?

The current price of NEOG is 5.93 USD — it has decreased -0.17 % in the last trading day.

arrow icon

What is Neogen Corp (NEOG)'s business?

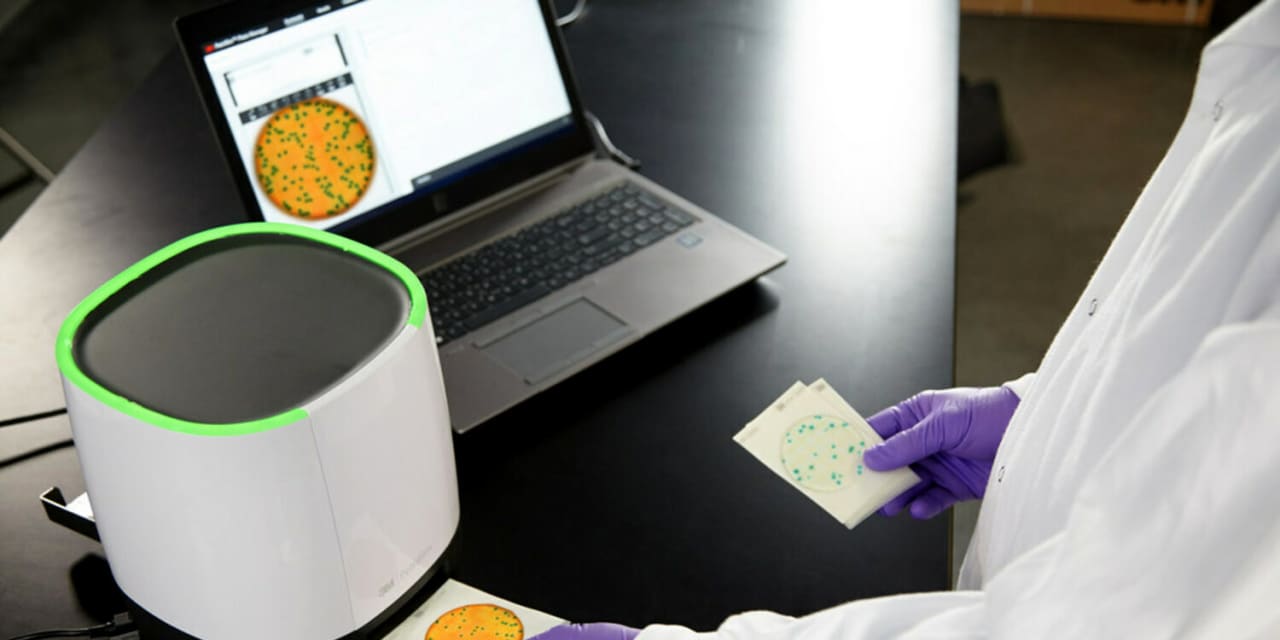
Neogen Corporation and subsidiaries are engaged in developing, manufacturing and marketing a diverse line of products and services dedicated to food and animal safety. The Company has developed comprehensive solutions spanning the Food Safety, Livestock, and Pet Health & Wellness markets. Its segments include Food Safety and Animal Safety. The Food Safety segment is primarily engaged in the development, production and marketing of diagnostic test kits and related products used by food producers and processors to detect harmful natural toxins, foodborne bacteria, allergens and levels of general sanitation. The Animal Safety segment is primarily engaged in the development, production and marketing of products dedicated to animal safety, including a complete line of consumable products marketed to veterinarians and animal health product distributors. This segment also provides genomic identification and related interpretive bioinformatic services.

arrow icon

What is the price predicton of NEOG Stock?

Wall Street analysts forecast NEOG stock price to rise over the next 12 months. According to Wall Street analysts, the average 1-year price target for NEOG is 8.17 USD with a low forecast of 6.50 USD and a high forecast of 10.00 USD. However, analyst price targets are subjective and often lag stock prices, so investors should focus on the objective reasons behind analyst rating changes, which better reflect the company's fundamentals.

arrow icon

What is Neogen Corp (NEOG)'s revenue for the last quarter?

Neogen Corp revenue for the last quarter amounts to 209.19M USD, decreased -3.58 % YoY.

arrow icon

What is Neogen Corp (NEOG)'s earnings per share (EPS) for the last quarter?

Neogen Corp. EPS for the last quarter amounts to 0.17 USD, decreased -383.33 % YoY.

arrow icon

What changes have occurred in the market's expectations for Neogen Corp (NEOG)'s fundamentals?

The market is revising Upward the revenue expectations for Neogen Corporation (NEOG) for FY2026, with the revenue forecasts being adjusted by 0.59% over the past three months. During the same period, the stock price has changed by 3.13%.
arrow icon

How many employees does Neogen Corp (NEOG). have?

Neogen Corp (NEOG) has 2974 emplpoyees as of December 05 2025.

arrow icon

What is Neogen Corp (NEOG) market cap?

Today NEOG has the market capitalization of 1.29B USD.

Intellectia LogoIntellectiaIntellectia LogoIntellectia

Redefine Your Investment Decisions

TwitterTwitterYoutubeYoutubeQuoraQuoraDiscordDiscordLinkedinLinkedinTelegramTelegram
AppStoreGooglePlay

Copyright © 2025 Intellectia.AI. All Rights Reserved.

pci certified logo
Company
HomeContactAbout UsNews Release
Compare
TradingViewSeeking Alpha
Features
Financial AI AgentStock Technical AnalysisStock MonitorHedge Fund TrackerAI ScreenerDaytrading Center
Strategies
AI Stock PickerSwing TradingStock Chart PatternsEarnings TradingDaytrading CenterAI Earnings PredictionQuant AIWhales Auto TrackerBacktesting Playground
Free Tools
Dividend CalculatorDividend Yield CalculatorOptions Profit Calculator
Resource
BlogTutorialEarningsTrending StocksCrypto MarketPartner ProgramTerms of UsePrivacy PolicySecuritySitemap
Start for Free