
VFS
VinFast Auto Ltd
- Overview
- Forecast
- Valuation
- Earnings

Line
|

Candle
1D
5D
1M
3M
6M
YTD
1Y
5Y
High
3.650
Open
3.650
VWAP
3.57
Vol
618.83K
Mkt Cap
8.28B
Low
3.530
Amount
2.21M
EV/EBITDA(TTM)
--
Total Shares
2.34B
EV
13.88B
EV/OCF(TTM)
--
P/S(TTM)
4.07
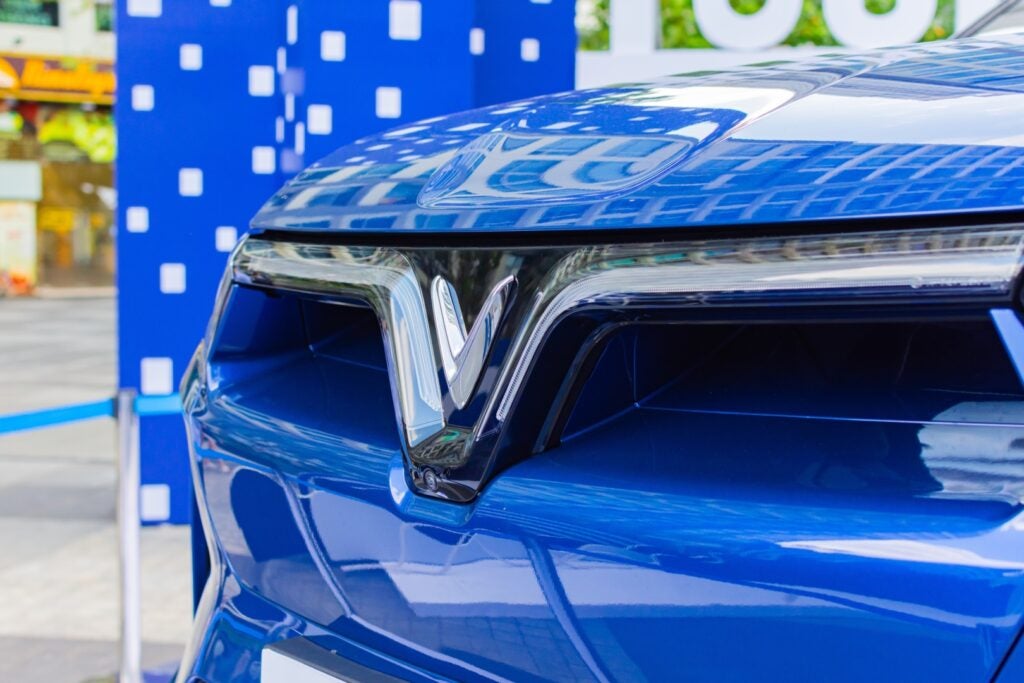
VinFast Auto Ltd is a full-scale mobility platform focused on designing and manufacturing electric vehicles (EVs), e-scooters and e-buses. Its segments include Car, E-scooter and Ebus. The Car segment includes the design, development, manufacturing and sales of cars and related battery lease and battery charging services for cars. The E-scooter segment includes the design, development, manufacturing and sales of e-scooters and related battery lease and battery charging services for e-scooters. The Ebus segment includes the design, development, manufacturing and sales of Ebus. Its passenger EV portfolio consists of various models, such as VF e34, VF 8, VF 9, VF 5, VF 6, VF 7, VF Wild, Limo Green, and Minio Green. It offers two trims of the VF 8 model in North America, Europe, Vietnam and the Middle East, the Eco and Plus. The Eco trim offers a longer driving range. The Plus trim offers high horsepower and luxury features, including a power-assisted tailgate.
Show More
Market Estimates
Earnings Estimates
Revenue
YoY Chg
EPS
YoYChg
FY2025Q4
FY2025Q3
FY2025Q2
26.61T
+50.83%
-0.285
-47.22%
20.92T
+60.86%
-0.270
+17.39%
17.27T
+96.13%
-0.263
-20.45%
Estimates Revision
The market is revising Downward the revenue expectations for VinFast Auto Ltd. (VFS) for FY2025, with the revenue forecasts being adjusted by -15% over the past three months. During the same period, the stock price has changed by 6.63%.
Revenue Estimates for FY2025
Revise Downward

-15%
In Past 3 Month
EPS Estimates for FY2025
Revise Upward

+28.4%
In Past 3 Month
Stock Price
Go Up

+6.63%
In Past 3 Month
4 Analyst Rating

64.69% Upside
Wall Street analysts forecast VFS stock price to rise over the next 12 months. According to Wall Street analysts, the average 1-year price target for VFS is 5.83 USD with a low forecast of 5.50 USD and a high forecast of 6.00 USD. However, analyst price targets are subjective and often lag stock prices, so investors should focus on the objective reasons behind analyst rating changes, which better reflect the company's fundamentals.
3 Buy
1 Hold
0 Sell
Strong Buy

64.69% Upside
Current: 3.540

Low
5.50
Averages
5.83
High
6.00

64.69% Upside
Current: 3.540

Low
5.50
Averages
5.83
High
6.00
BTIG
Buy
to
Neutral
downgrade
2025-04-24
Reason
BTIG
Price Target
2025-04-24
downgrade
Buy
to
Neutral
Reason
BTIG downgraded VinFast Auto to Neutral from Buy.
BTIG
Buy
to
Neutral
downgrade
2025-04-24
Reason
BTIG
Price Target
2025-04-24
downgrade
Buy
to
Neutral
Reason
As previously reported, BTIG downgraded VinFast Auto to Neutral from Buy with no price target after the company reported Q4 results. Delivery guidance was maintained, but the firm expects profitability to be "a major focus for investors" as EV pricing continues to move lower globally, pushing out profitability breakeven for VinFast. Profitability "remains elusive for now," the analyst added.
Cantor Fitzgerald
Andres Sheppard
Buy
Reiterates
$6
2024-09-30
Reason
Cantor Fitzgerald
Andres Sheppard
Price Target
$6
2024-09-30
Reiterates
Buy
Reason
Cantor Fitzgerald
Andres Sheppard
Buy
Reiterates
$6
2024-09-23
Reason
Cantor Fitzgerald
Andres Sheppard
Price Target
$6
2024-09-23
Reiterates
Buy
Reason
Cantor Fitzgerald
Andres Sheppard
Buy
Reiterates
$8
2024-09-09
Reason
Cantor Fitzgerald
Andres Sheppard
Price Target
$8
2024-09-09
Reiterates
Buy
Reason
Cantor Fitzgerald
Andres Sheppard
Buy
Reiterates
$8
2024-09-03
Reason
Cantor Fitzgerald
Andres Sheppard
Price Target
$8
2024-09-03
Reiterates
Buy
Reason
See All Ratings
Valuation Metrics
The current forward P/E ratio for VinFast Auto Ltd (VFS.O) is -3.39, compared to its 5-year average forward P/E of -4.11. For a more detailed relative valuation and DCF analysis to assess VinFast Auto Ltd 's fair value, click here.
Forward PE
The forward P/E ratio is a valuation metric that divides a company's current stock price by its estimated future earnings per share over the next 12 months.

N/A
5Y Average PE
-4.11
Current PE
-3.39
Overvalued PE
-0.48
Undervalued PE
-7.74
Forward EV/EBITDA
The forward EV/EBITDA ratio is a valuation metric that divides a company's enterprise value (EV) by its estimated future earnings before interest, taxes, depreciation, and amortization (EBITDA) over the next 12 months.

N/A
5Y Average EV/EBITDA
-8.74
Current EV/EBITDA
-12.45
Overvalued EV/EBITDA
-0.77
Undervalued EV/EBITDA
-16.71
Forward PS
The forward P/S ratio is a valuation metric that divides a company's current stock price by its estimated future sales (or revenue) per share over the next 12 months.

N/A
5Y Average PS
3.54
Current PS
2.50
Overvalued PS
10.27
Undervalued PS
-3.19
Financials
Annual
Quarterly
FY2025Q1
YoY :
+149.87%
16.31T
Total Revenue
FY2025Q1
YoY :
+20.25%
-12.06T
Operating Profit
FY2025Q1
YoY :
+20.01%
-17.69T
Net Income after Tax
FY2025Q1
YoY :
+19.99%
-7.56K
EPS - Diluted
FY2025Q1
YoY :
+8.78%
-18.73T
Free Cash Flow
FY2024Q4
YoY :
+96.79%
-79.13
Gross Profit Margin - %
FY2024Q4
YoY :
-60.87%
-107.13
FCF Margin - %
FY2024Q4
YoY :
+23.55%
-185.46
Net Margin - %
Trading Trends
Insider
Insiders are Neutral. There are no significant trading trends over the last month.
Sold
0-3
Months
0.0
USD
0
3-6
Months
0.0
USD
0
6-9
Months
0.0
USD
0
0-12
Months
0.0
USD
0
Bought
0-3
0
0.0
USD
Months
3-6
0
0.0
USD
Months
6-9
0
0.0
USD
Months
0-12
0
0.0
USD
Months
Hedge Fund
Hedge Funds are Neutral. There are no significant trading trends over the last quarter.
Sold
0-3
Months
0.0
Volume
0
3-6
Months
0.0
Volume
0
6-9
Months
0.0
Volume
0
0-12
Months
0.0
Volume
0
Bought
0-3
0
0.0
Volume
Months
3-6
0
0.0
Volume
Months
6-9
0
0.0
Volume
Months
0-12
0
0.0
Volume
Months
Congress Trading
Congress are Neutral. There are no significant trading trends over the last month.
Sold
0-3
Months
0.0
USD
0
3-6
Months
0.0
USD
0
6-9
Months
0.0
USD
0
0-12
Months
0.0
USD
0
Bought
0-3
0
0.0
USD
Months
3-6
0
0.0
USD
Months
6-9
0
0.0
USD
Months
0-12
0
0.0
USD
Months
Insider
Insiders are Neutral. There are no significant trading trends over the last month.
Sold
0-3
Months
0.0
USD
0
3-6
Months
0.0
USD
0
6-9
Months
0.0
USD
0
0-12
Months
0.0
USD
0
Bought
0-3
0
0.0
USD
Months
3-6
0
0.0
USD
Months
6-9
0
0.0
USD
Months
0-12
0
0.0
USD
Months
VFS News & Events
Events Timeline
2025-07-10 (ET)
2025-07-10
06:07:06
VinFast Auto highlights shift from product-led to customer-led sales

2025-06-29 (ET)
2025-06-29
15:02:56
VinFast Auto begins production at second domestic factory, Reuters reports


2025-06-18 (ET)
2025-06-18
10:03:50
VinFast Auto announces first authorized dealership in California

Sign Up For More Events
News
5.0
07-11BenzingaWhat's Going On With VinFast Stock Today?
7.0
07-11SeekingAlphaVinFast Auto is expected to see more sales from India and Indonesia in the second half of the year
4.0
07-07BenzingaChardan Capital Maintains Buy on VinFast Auto, Maintains $5.5 Price Target
Sign Up For More News
People Also Watch

LAD
Lithia Motors Inc
309.780
USD
-3.01%

ALTR
Altair Engineering Inc
0
USD
+0.14%

WTRG
Essential Utilities Inc
37.170
USD
-1.41%

DOX
Amdocs Ltd
88.410
USD
-1.45%

EXAS
Exact Sciences Corp
48.770
USD
+0.74%

DRS
Leonardo DRS Inc
47.450
USD
-0.17%

EHC
Encompass Health Corp
107.130
USD
-1.51%

DBX
Dropbox Inc
27.910
USD
-0.85%

WCC
Wesco International Inc
211.750
USD
-0.36%

GNRC
Generac Holdings Inc
153.390
USD
+0.31%
FAQ

What is VinFast Auto Ltd (VFS) stock price today?
The current price of VFS is 3.54 USD — it has decreased -3.28 % in the last trading day.

What is VinFast Auto Ltd (VFS)'s business?

What is the price predicton of VFS Stock?

What is VinFast Auto Ltd (VFS)'s revenue for the last quarter?

What is VinFast Auto Ltd (VFS)'s earnings per share (EPS) for the last quarter?

What changes have occurred in the market's expectations for VinFast Auto Ltd (VFS)'s fundamentals?

How many employees does VinFast Auto Ltd (VFS). have?
