Intellectia LogoIntellectia
Product
Resources
Markets
News
Partner Program
Pricing
Log inTry for Free
Intellectia Logo
Log in
Intellectia Logo

Product

Features
Financial AI Agent
Stock Technical Analysis
Stock Monitor
Hedge Fund Tracker
AI Screener
Trading Strategies
AI Stock Picker
Swing Trading
Quant AI
Stock Chart Patterns
Daytrading Center
AI Earnings Prediction
Whales Auto Tracker
Backtesting Playground

Resources

Learn
Blog
Earnings
Tutorial
Help Center
Company
About Us
Contact
Press
Reward Program
Partner Program
Tools
Dividend Calculator
Dividend Yield Calculator
Options Profit Calculator
Compare
TradingView
SeekingAlpha

Markets

Trending Stocks
Hot Crypto
Trending News
All Stocks

News

Trading News
Overview
Top News
Daily Market Brief
Earnings
Latest
Newswire
Stock News
Crypto News
Monitor News
Partner ProgramPricing
Start for Free
  1. Home
  2. >
  3. Stock
  4. >
  5. TROX
stocks logo

TROX

-
collectAdd to Watchlistadvanced chartAdvanced Chart
$
0.000
0(0.000%)1D
collectadvanced chart
    Overview
    Forecast
    Valuation
    Earnings
High
--
Open
--
VWAP
--
Vol
--
Mkt Cap
--
Low
--
Amount
--
EV/EBITDA(TTM)
--
Total Shares
--
EV
--
EV/OCF(TTM)
--
P/S(TTM)
--
AI Stock Picker
AI Stock Picker

Market Estimates

Earnings Estimates
Earnings Estimates
Revenue
YoY Chg
EPS
YoYChg
FY2025Q4
FY2026Q1
FY2026Q2
687.43M
+1.69%
-0.231
-871.3%
743.36M
+0.73%
-0.188
+25.56%
763.15M
+4.4%
-0.096
-65.59%
Estimates Revision
The market is revising Downward the revenue expectations for Tronox Holdings plc (TROX) for FY2025, with the revenue forecasts being adjusted by -3.05% over the past three months. During the same period, the stock price has changed by -14.51%.
Revenue Estimates for FY2025
Revise Downward
down Image
-3.05%
In Past 3 Month
EPS Estimates for FY2025
Revise Upward
up Image
+107.08%
In Past 3 Month
Stock Price
Go Down
down Image
-14.51%
In Past 3 Month
Wall Street analysts forecast TROX stock price to fall over the next 12 months. According to Wall Street analysts, the average 1-year price target for TROX is 3.80 USD with a low forecast of 1.00 USD and a high forecast of 6.00 USD. However, analyst price targets are subjective and often lag stock prices, so investors should focus on the objective reasons behind analyst rating changes, which better reflect the company's fundamentals.
7 Analyst Rating
Wall Street analysts forecast TROX stock price to fall over the next 12 months. According to Wall Street analysts, the average 1-year price target for TROX is 3.80 USD with a low forecast of 1.00 USD and a high forecast of 6.00 USD. However, analyst price targets are subjective and often lag stock prices, so investors should focus on the objective reasons behind analyst rating changes, which better reflect the company's fundamentals.
2 Buy
3 Hold
2 Sell
Hold
Current: 3.830
sliders
Low
1.00
Averages
3.80
High
6.00
Current: 3.830
sliders
Low
1.00
Averages
3.80
High
6.00
UBS
Neutral
downgrade
2025-11-11
Reason
UBS
Price Target
2025-11-11
downgrade
Neutral
Reason
UBS lowered the firm's price target on Tronox to $3.80 from $3.90 and keeps a Neutral rating on the shares. Progress on a free cash flow and earnings turn could take longer than expected, the analyst tells investors in a research note.
Mizuho
NULL -> Underperform
downgrade
$3
2025-11-06
Reason
Mizuho
Price Target
$3
2025-11-06
downgrade
NULL -> Underperform
Reason
Mizuho lowered the firm's price target on Tronox to $3 from $3.50 and keeps an Underperform rating on the shares.
Truist
Buy
downgrade
$6 -> $5
2025-10-20
Reason
Truist
Price Target
$6 -> $5
2025-10-20
downgrade
Buy
Reason
Truist lowered the firm's price target on Tronox to $5 from $6 and keeps a Buy rating on the shares. Truist expects TiO2 pricing declines to drive lower quarter over quarter earnings and sees potential for further sequential TiO2 price declines in Q4, the analyst tells investors in a research note.
Mizuho
Underperform
downgrade
$4
2025-10-16
Reason
Mizuho
Price Target
$4
2025-10-16
downgrade
Underperform
Reason
Mizuho lowered the firm's price target on Tronox to $3.50 from $4 and keeps an Underperform rating on the shares. The firm says the TiO2 industry has bifurcated into essentially China versus western multi-national producers.
Truist
Buy
maintain
$5 -> $6
2025-09-16
Reason
Truist
Price Target
$5 -> $6
2025-09-16
maintain
Buy
Reason
Truist raised the firm's price target on Tronox to $6 from $5 and keeps a Buy rating on the shares as part of a broader research note on Chemicals names. Shares have outperformed sector peers and the S&P over the last month, but the firm sees additional upside as it believes that the TiO2 industry is showing signs of incremental pricing discipline and production curtailments that, combined with continued implementations of anti-dumping duties targeting Chinese exports, have the potential to contribute to meaningful earnings growth, the analyst tells investors in a research note.
Alembic Global
Hassan Ahmed
maintain
$5 -> $6
2025-09-15
Reason
Alembic Global
Hassan Ahmed
Price Target
$5 -> $6
2025-09-15
maintain
Reason
Alembic Global analyst Hassan Ahmed raised the firm's price target on Tronox to $6 from $5 and keeps an Overweight rating on the shares.
See All Ratings

Valuation Metrics

The current forward P/E ratio for Tronox Holdings PLC (TROX.N) is -5.70, compared to its 5-year average forward P/E of 14.13. For a more detailed relative valuation and DCF analysis to assess Tronox Holdings PLC 's fair value, click here.
  • Forward PE
  • Forward EV/EBITDA
  • Forward PS

Forward PE

The forward P/E ratio is a valuation metric that divides a company's current stock price by its estimated future earnings per share over the next 12 months.
StronglyUndervaluedUndervaluedFairOvervaluedStronglyOvervalueddotted line Image
N/A
5Y Average PE
14.13
Current PE
-5.70
Overvalued PE
34.07
Undervalued PE
-5.82

Forward EV/EBITDA

The forward EV/EBITDA ratio is a valuation metric that divides a company's enterprise value (EV) by its estimated future earnings before interest, taxes, depreciation, and amortization (EBITDA) over the next 12 months.
StronglyUndervaluedUndervaluedFairOvervaluedStronglyOvervalueddotted line Image
N/A
5Y Average EV/EBITDA
7.05
Current EV/EBITDA
0.00
Overvalued EV/EBITDA
8.41
Undervalued EV/EBITDA
5.70

Forward PS

The forward P/S ratio is a valuation metric that divides a company's current stock price by its estimated future sales (or revenue) per share over the next 12 months.
StronglyUndervaluedUndervaluedFairOvervaluedStronglyOvervalueddotted line Image
N/A
5Y Average PS
0.68
Current PS
0.00
Overvalued PS
0.90
Undervalued PS
0.45
Financial AI Agent
Financial AI Agent

Financials

Annual
Quarterly
N/A
Total Revenue
N/A
Operating Profit
N/A
Net Income after Tax
N/A
EPS - Diluted
N/A
Free Cash Flow
N/A
Gross Profit Margin - %
N/A
Net Margin - %

Trading Trends

  • Insider
  • Hedge Fund
  • Congress Trading
Insider
Insiders areBuying! The selling amount has increased 1304.69% over the last month.
Sold
Bought
Hedge Fund
Hedge Funds are Neutral. There are no significant trading trends over the last quarter.
Sold
Bought
Congress Trading
Congress are Neutral. There are no significant trading trends over the last month.
Sold
Bought
Insider
Insiders areBuying! The selling amount has increased 1304.69% over the last month.
Sold
Bought
Intellectia AI SwingMax

TROX News & Events

Events Timeline

(ET)
2025-11-05
16:41:43
Tronox Reports Q4 Revenue and Adjusted EBITDA Remain 'Relatively Stable' Compared to Q3
select
2025-11-05
16:39:31
Tronox announces Q3 adjusted earnings per share of 46 cents, surpassing consensus estimate of 21 cents.
select
2025-10-03 (ET)
2025-10-03
08:54:43
Video: Jefferies Recommends Selling Apple Stock Due to Overly Optimistic iPhone Projections
select
link
Sign Up For More Events

News

[object Object]
Preview
9.0
12-04SeekingAlpha
PinnedTronox Creditors Reach Cooperation Agreement Following Revenue Decline - Bloomberg
  • Cooperation Agreement: Some creditors of Tronox have signed a cooperation agreement to facilitate discussions regarding the company's significant debt load.

  • Debt Overview: As of September 30, Tronox had over $3 billion in long-term debt, with a term loan due in 2029 trading at $0.79 on the dollar.

  • Financial Performance: The company reported a 13% year-over-year decline in Q3 revenues to $699 million, while adjusted EBITDA fell 48% to $74 million compared to the previous year.

  • Market Challenges: Tronox is facing challenges such as competition, weak demand, and pricing pressure, which have contributed to its declining sales volume and revenues.

[object Object]
Preview
4.5
12-04NASDAQ.COM
ETF Movers for Thursday: URA and REMX
  • ETF Performance: The VanEck Rare Earth/Strategic Metals ETF is down approximately 3.3% in Thursday afternoon trading, underperforming other ETFs.

  • Weakest Components: Key components contributing to the ETF's decline include Tronox Holdings, which fell by about 3.2%, and Albemarle, which decreased by around 2.5%.

  • Market Context: The article provides insights into the performance of specific ETFs and their components on a particular trading day.

  • Author's Perspective: The views expressed in the article are those of the author and do not necessarily represent the opinions of Nasdaq, Inc.

[object Object]
Preview
6.5
12-04Benzinga
Top Wall Street Analysts Share Insights on 3 High-Dividend Yield Materials Stocks
  • Investor Interest in Dividend Stocks: In uncertain market conditions, investors are increasingly looking at dividend-yielding stocks, which typically have high free cash flows and offer substantial payouts to shareholders.

  • FMC Corp Updates: FMC Corp has a dividend yield of 17.06%. Analysts have downgraded its price target significantly, with recent news indicating a reduction in FY2025 earnings and sales guidance.

  • Eastman Chemical Co Performance: Eastman Chemical Co offers a 5.39% dividend yield. Analysts have also lowered their price targets following weaker-than-expected quarterly results reported on Nov. 3.

  • Tronox Holdings Financial Results: Tronox Holdings has a dividend yield of 5.08%. The company faced downgrades from analysts after reporting disappointing third-quarter financial results on Nov. 5.

Sign Up For More News

People Also Watch

FAQ

arrow icon

What is Tronox Holdings PLC (TROX) stock price today?

The current price of TROX is 3.83 USD — it has decreased -2.79 % in the last trading day.

arrow icon

What is Tronox Holdings PLC (TROX)'s business?

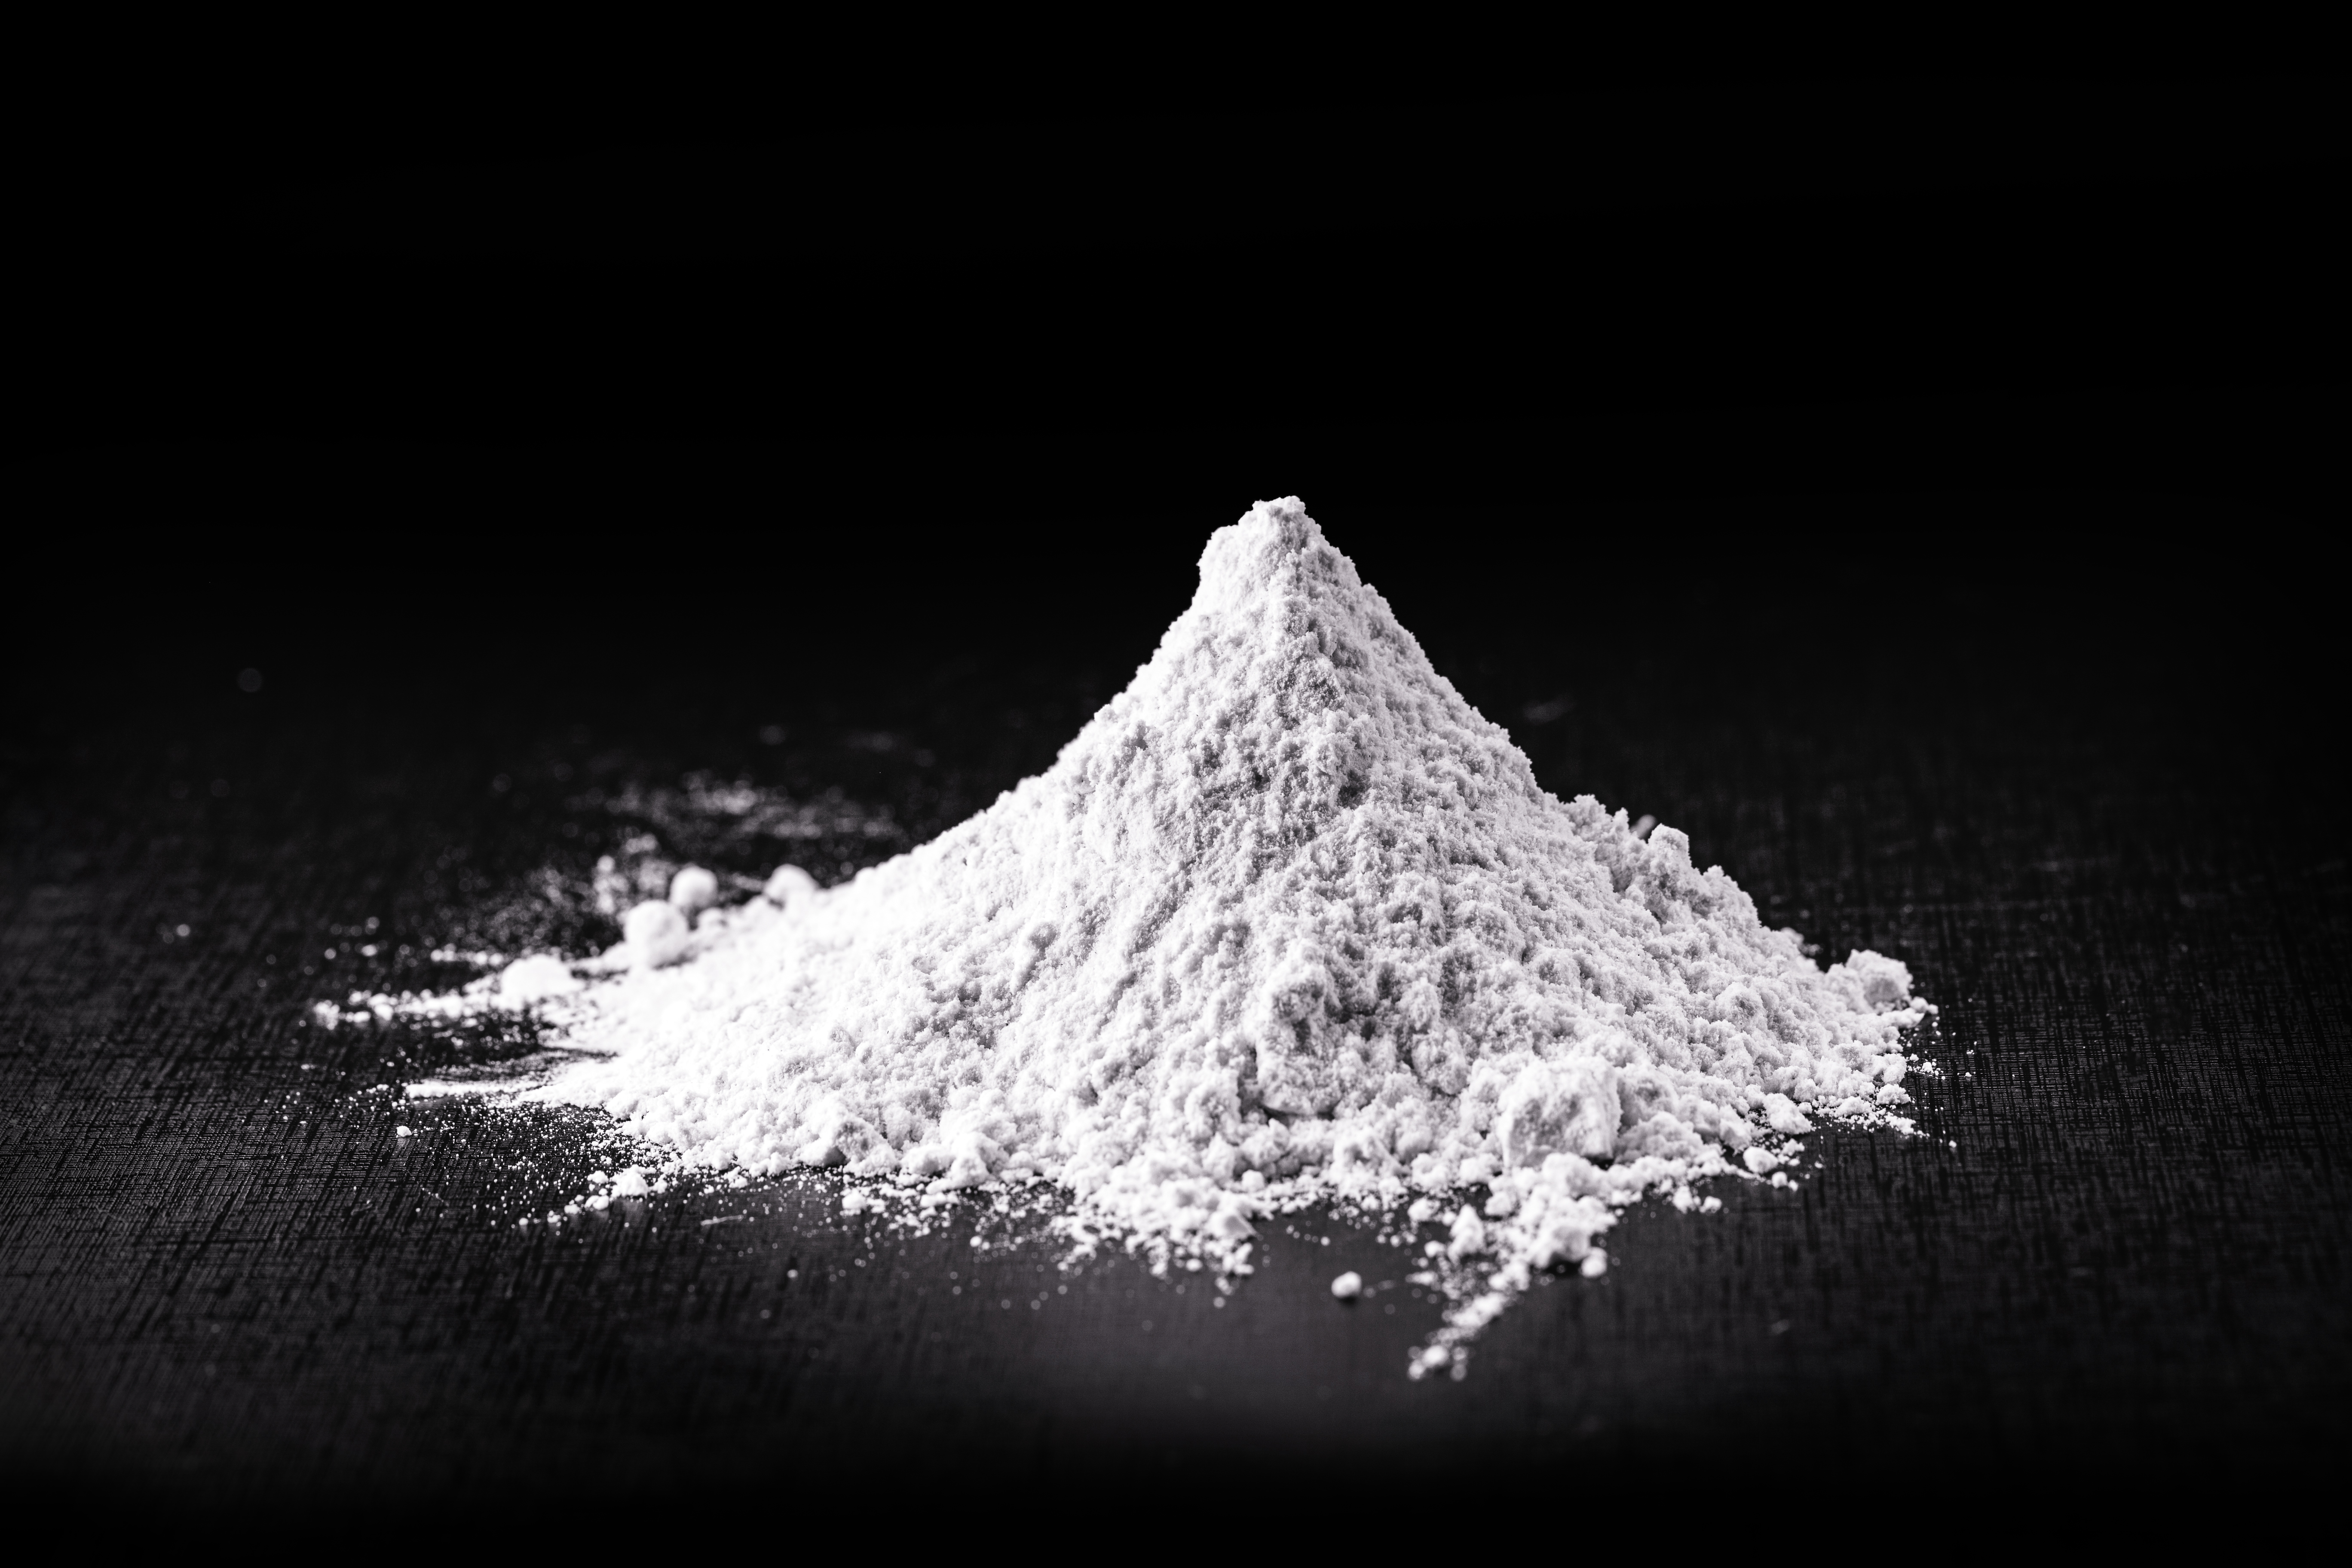
Tronox Holdings plc is a producer of titanium products, including titanium dioxide (TiO2) pigment, specialty-grade titanium dioxide products and high-purity titanium chemicals, and zircon. The Company is a vertically integrated manufacturer of TiO2 pigment. It mines titanium-bearing mineral sands and operates upgrading facilities that produce high-grade titanium feedstock materials, pig iron and other minerals, including the rare earth-bearing mineral, monazite. It operates titanium-bearing mineral sand mines and beneficiation and smelting operations in Australia and South Africa to produce feedstock materials that can be processed into TiO2 for pigment, high-purity titanium chemicals, including titanium tetrachloride, and ultrafine TiO2 used in certain specialty applications. The Company supplies and markets TiO2 under the brand names TIONA and CristalActiv. It has nine pigment facilities located in the United States, Australia, Brazil, and the United Kingdom, among others.

arrow icon

What is the price predicton of TROX Stock?

Wall Street analysts forecast TROX stock price to fall over the next 12 months. According to Wall Street analysts, the average 1-year price target for TROX is 3.80 USD with a low forecast of 1.00 USD and a high forecast of 6.00 USD. However, analyst price targets are subjective and often lag stock prices, so investors should focus on the objective reasons behind analyst rating changes, which better reflect the company's fundamentals.

arrow icon

What is Tronox Holdings PLC (TROX)'s revenue for the last quarter?

Tronox Holdings PLC revenue for the last quarter amounts to 699.00M USD, decreased -13.06 % YoY.

arrow icon

What is Tronox Holdings PLC (TROX)'s earnings per share (EPS) for the last quarter?

Tronox Holdings PLC. EPS for the last quarter amounts to -0.62 USD, increased 287.50 % YoY.

arrow icon

What changes have occurred in the market's expectations for Tronox Holdings PLC (TROX)'s fundamentals?

The market is revising Downward the revenue expectations for Tronox Holdings plc (TROX) for FY2025, with the revenue forecasts being adjusted by -3.05% over the past three months. During the same period, the stock price has changed by -14.51%.
arrow icon

How many employees does Tronox Holdings PLC (TROX). have?

Tronox Holdings PLC (TROX) has 6500 emplpoyees as of December 05 2025.

arrow icon

What is Tronox Holdings PLC (TROX) market cap?

Today TROX has the market capitalization of 607.26M USD.

Intellectia LogoIntellectiaIntellectia LogoIntellectia

Redefine Your Investment Decisions

TwitterTwitterYoutubeYoutubeQuoraQuoraDiscordDiscordLinkedinLinkedinTelegramTelegram
AppStoreGooglePlay

Copyright © 2025 Intellectia.AI. All Rights Reserved.

pci certified logo
Company
HomeContactAbout UsNews Release
Compare
TradingViewSeeking Alpha
Features
Financial AI AgentStock Technical AnalysisStock MonitorHedge Fund TrackerAI ScreenerDaytrading Center
Strategies
AI Stock PickerSwing TradingStock Chart PatternsEarnings TradingDaytrading CenterAI Earnings PredictionQuant AIWhales Auto TrackerBacktesting Playground
Free Tools
Dividend CalculatorDividend Yield CalculatorOptions Profit Calculator
Resource
BlogTutorialEarningsTrending StocksCrypto MarketPartner ProgramTerms of UsePrivacy PolicySecuritySitemap
Start for Free