CVI Overview
-
$
0.000
0.000(0.000%)
At close0.000(0.000%)Aft-market
ET
Loading chart...

The current price of CVI is 27.4 USD — it has decreased -1.01
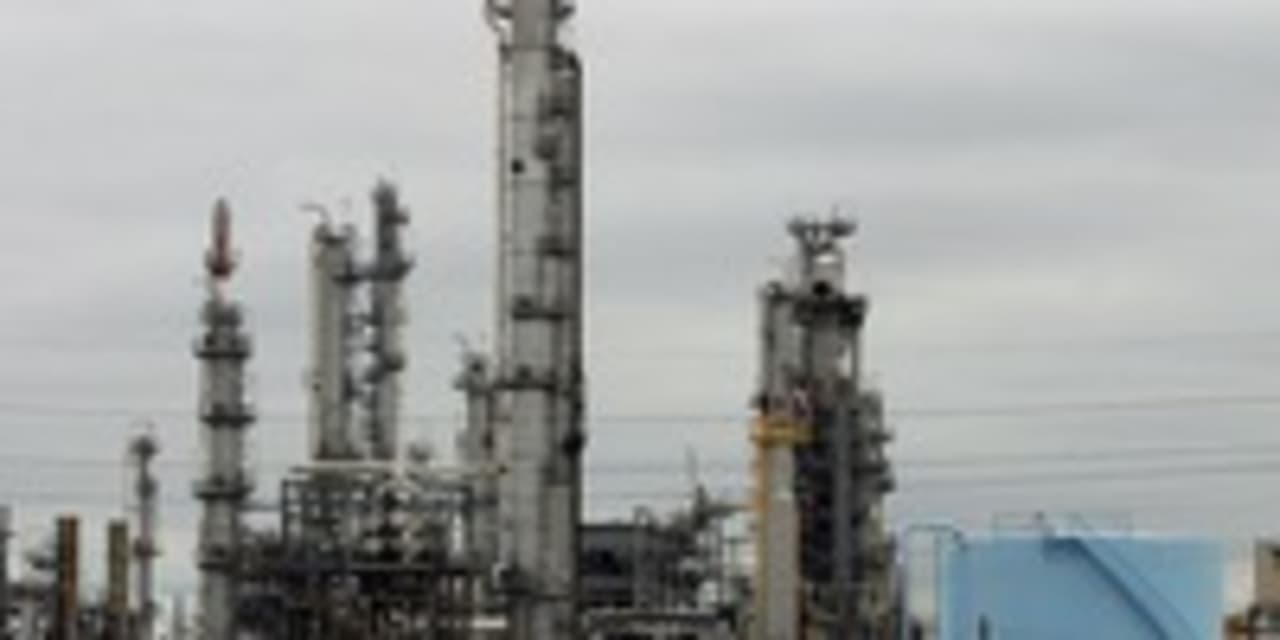
CVR Energy, Inc. is a diversified holding company primarily engaged in the renewable fuels and petroleum refining and marketing businesses, as well as in the nitrogen fertilizer manufacturing business through its interest in CVR Partners, LP. The Company's segments include Petroleum Segment, Renewables Segment and Nitrogen Fertilizer Segment. Petroleum Segment includes the refining and marketing of high value transportation fuels which consist of gasoline, diesel, jet fuel, and distillates. The Petroleum Segment also includes activities related to crude gathering and logistics that support the refinery operations. Renewables Segment includes the refining of renewable feedstocks, such as soybean oil, corn oil, and other renewable feedstocks, into renewable diesel and marketing of renewables products. Nitrogen Fertilizer Segment includes the production and distribution of nitrogen fertilizer products, primarily in the form of ammonia and urea ammonium nitrate, for the farming industry.
Wall Street analysts forecast CVI stock price to rise over the next 12 months. According to Wall Street analysts, the average 1-year price target for CVI is28.50 USD with a low forecast of 25.00 USD and a high forecast of 35.00 USD. However, analyst price targets are subjective and often lag stock prices, so investors should focus on the objective reasons behind analyst rating changes, which better reflect the company's fundamentals.
CVR Energy Inc revenue for the last quarter amounts to 1.98B USD, increased 20.29
CVR Energy Inc. EPS for the last quarter amounts to -1.91 USD, increased 56.56
CVR Energy Inc (CVI) has 1532 emplpoyees as of June 20 2026.
Today CVI has the market capitalization of 2.75B USD.