SM Overview
-
$
0.000
0.000(0.000%)
At close0.000(0.000%)Aft-market
ET
Loading chart...

The current price of SM is 27.14 USD — it has decreased -3.38
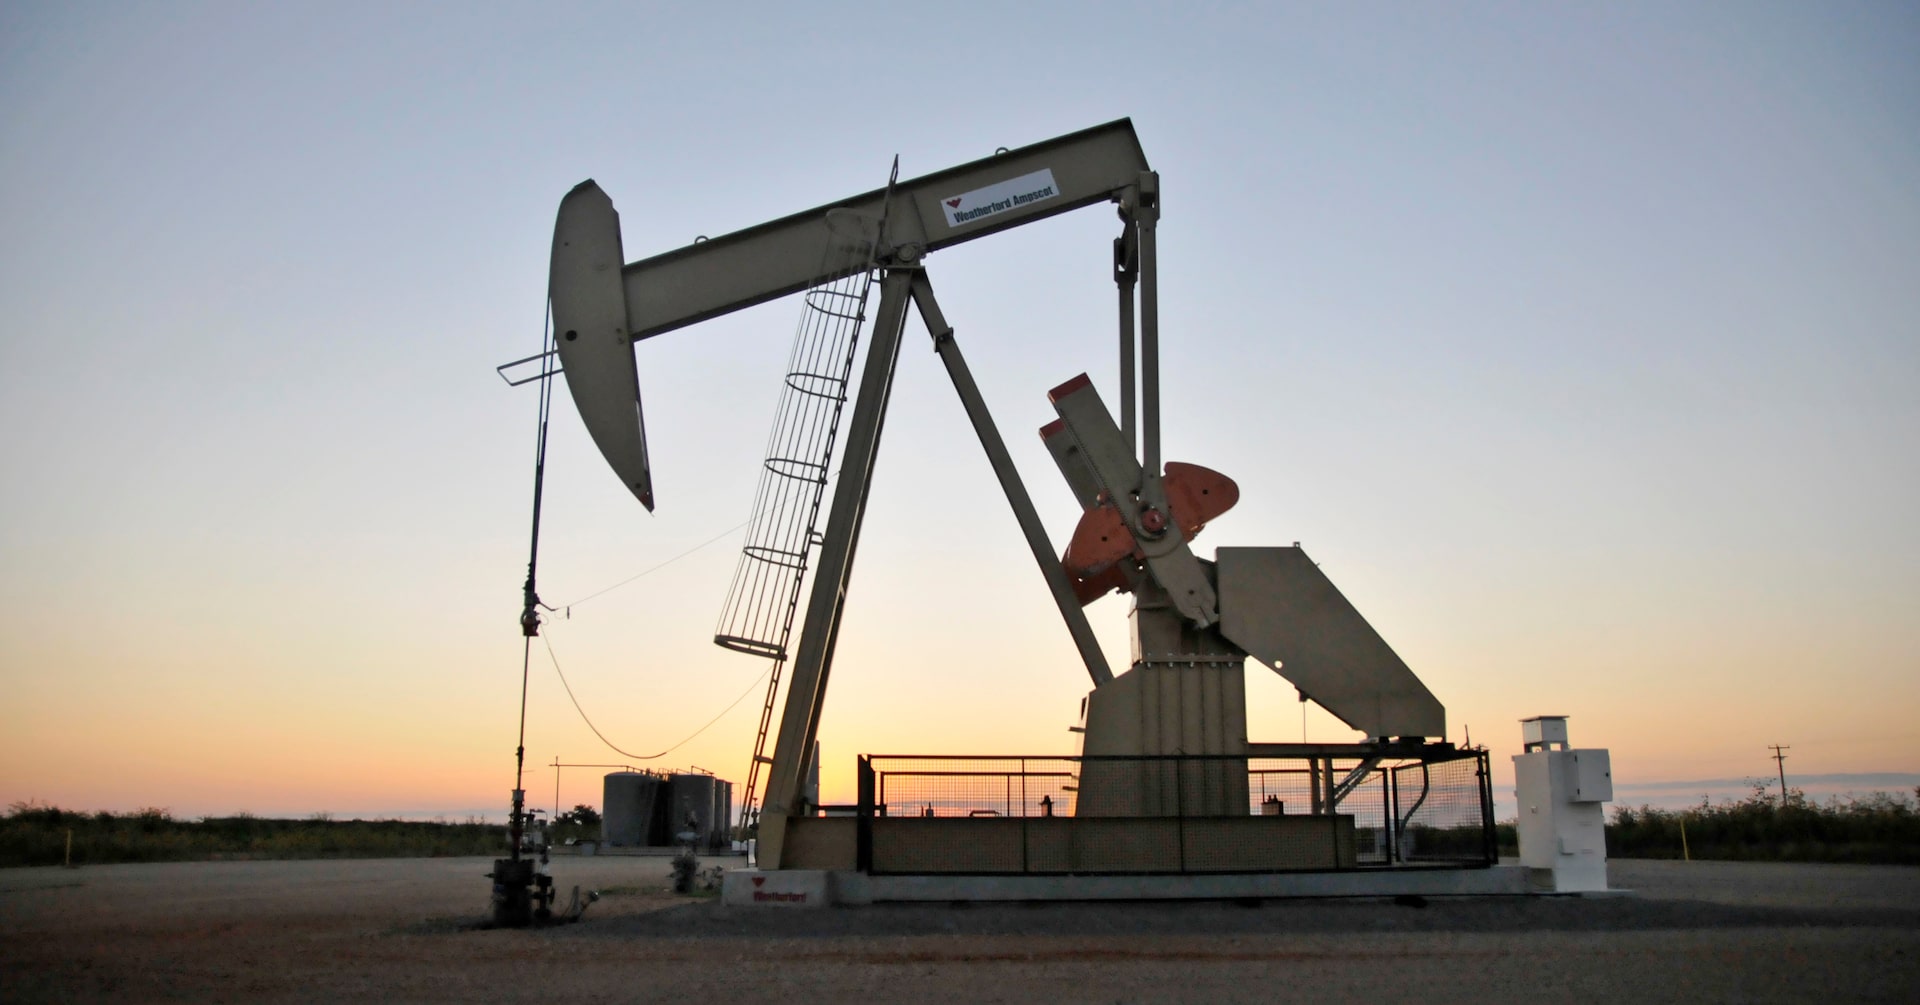
SM Energy Company is an independent energy company. It is a premier, scaled operator of top-tier oil and gas assets across United States shale basins, including the Permian Basin, DJ Basin, and Uinta Basin. The Permian Basin is a sedimentary basin in western Texas and southeastern New Mexico, United States noted for its petroleum, natural gas, and potassium deposits. The Permian Basin is made up of three component parts: the eastern Midland Basin, the Central Basin Platform, and the western Delaware Basin. Permian Basin assets comprise approximately 229,000 net acres located in the Midland Basin and Delaware Basin of West Texas and New Mexico. The DJ Basin assets comprise approximately 303,000 net acres located primarily in northeastern Colorado (DJ Basin) and provide development and exploration opportunities within multiple oil-rich intervals in the Niobrara and Codell formations. The Uinta Basin assets comprise approximately 62,000 net acres in northeastern Utah (Uinta Basin).
Wall Street analysts forecast SM stock price to rise over the next 12 months. According to Wall Street analysts, the average 1-year price target for SM is30.00 USD with a low forecast of 23.00 USD and a high forecast of 42.00 USD. However, analyst price targets are subjective and often lag stock prices, so investors should focus on the objective reasons behind analyst rating changes, which better reflect the company's fundamentals.
SM Energy Co revenue for the last quarter amounts to 1.48B USD, increased 23.87
SM Energy Co. EPS for the last quarter amounts to -1.68 USD, decreased -184.42
SM Energy Co (SM) has 1241 emplpoyees as of June 21 2026.
Today SM has the market capitalization of 6.51B USD.