Intellectia LogoIntellectia
Product
Resources
Markets
News
Partner Program
Pricing
Log inTry for Free
Intellectia Logo
Log in
Intellectia Logo

Product

Features
Financial AI Agent
Stock Technical Analysis
Stock Monitor
Hedge Fund Tracker
AI Screener
Trading Strategies
AI Stock Picker
Swing Trading
Quant AI
Stock Chart Patterns
Daytrading Center
AI Earnings Prediction
Whales Auto Tracker
Backtesting Playground

Resources

Learn
Blog
Earnings
Tutorial
Help Center
Company
About Us
Contact
Press
Reward Program
Partner Program
Tools
Dividend Calculator
Dividend Yield Calculator
Options Profit Calculator
Compare
TradingView
SeekingAlpha

Markets

Trending Stocks
Hot Crypto
Trending News
All Stocks

News

Trading News
Overview
Top News
Daily Market Brief
Earnings
Latest
Newswire
Stock News
Crypto News
Monitor News
Partner ProgramPricing
Start for Free
  1. Home
  2. >
  3. Stock
  4. >
  5. CENX
stocks logo

CENX

-
collectAdd to Watchlistadvanced chartAdvanced Chart
$
0.000
0(0.000%)1D
collectadvanced chart
    Overview
    Forecast
    Valuation
    Earnings
High
--
Open
--
VWAP
--
Vol
--
Mkt Cap
--
Low
--
Amount
--
EV/EBITDA(TTM)
--
Total Shares
--
EV
--
EV/OCF(TTM)
--
P/S(TTM)
--
AI Stock Picker
AI Stock Picker

Market Estimates

Earnings Estimates
Earnings Estimates
Revenue
YoY Chg
EPS
YoYChg
FY2025Q4
FY2026Q1
FY2026Q2
649.23M
+2.89%
1.205
+145.92%
665.00M
+4.91%
1.010
+180.56%
680.00M
+8.26%
1.120
+273.33%
Estimates Revision
The market is revising Downward the revenue expectations for Century Aluminum Company (CENX) for FY2025, with the revenue forecasts being adjusted by -0.78% over the past three months. During the same period, the stock price has changed by 39.70%.
Revenue Estimates for FY2025
Revise Downward
down Image
-0.78%
In Past 3 Month
EPS Estimates for FY2025
Revise Upward
up Image
+0.85%
In Past 3 Month
Stock Price
Go Up
up Image
+39.70%
In Past 3 Month
Wall Street analysts forecast CENX stock price to rise over the next 12 months. According to Wall Street analysts, the average 1-year price target for CENX is 32.00 USD with a low forecast of 28.00 USD and a high forecast of 34.00 USD. However, analyst price targets are subjective and often lag stock prices, so investors should focus on the objective reasons behind analyst rating changes, which better reflect the company's fundamentals.
3 Analyst Rating
Wall Street analysts forecast CENX stock price to rise over the next 12 months. According to Wall Street analysts, the average 1-year price target for CENX is 32.00 USD with a low forecast of 28.00 USD and a high forecast of 34.00 USD. However, analyst price targets are subjective and often lag stock prices, so investors should focus on the objective reasons behind analyst rating changes, which better reflect the company's fundamentals.
3 Buy
0 Hold
0 Sell
Strong Buy
Current: 30.860
sliders
Low
28.00
Averages
32.00
High
34.00
Current: 30.860
sliders
Low
28.00
Averages
32.00
High
34.00
BMO Capital
Outperform
maintain
$30 -> $34
2025-11-07
Reason
BMO Capital
Price Target
$30 -> $34
2025-11-07
maintain
Outperform
Reason
BMO Capital raised the firm's price target on Century Aluminum to $34 from $30 and keeps an Outperform rating on the shares. The company's Q3 EBITDA was below its guide, but earnings and free cash flow in Q4 are expected to improve materially as Century is expected to benefit from higher aluminum/MWP prices, the analyst tells investors in a research note.
Wells Fargo
Overweight
downgrade
$37 -> $34
2025-10-23
Reason
Wells Fargo
Price Target
$37 -> $34
2025-10-23
downgrade
Overweight
Reason
Wells Fargo lowered the firm's price target on Century Aluminum to $34 from $37 and keeps an Overweight rating on the shares. The firm cites a potential lost $100M in its quick early assessment of the company's announced equipment failure at its Iceland smelter. U.S. pricing positives and a strong LME value can support shares, in Wells' view.
B. Riley
Nick Giles
Buy
maintain
$25 -> $28
2025-09-09
Reason
B. Riley
Nick Giles
Price Target
$25 -> $28
2025-09-09
maintain
Buy
Reason
B. Riley analyst Nick Giles raised the firm's price target on Century Aluminum to $28 from $25 and keeps a Buy rating on the shares. The firm cites forward curve updates for the target increase.
B. Riley
Buy
maintain
$24 -> $25
2025-08-08
Reason
B. Riley
Price Target
$24 -> $25
2025-08-08
maintain
Buy
Reason
B. Riley raised the firm's price target on Century Aluminum to $25 from $24 and keeps a Buy rating on the shares. The company missed Q2 estimates but tariff tailwinds position it for a strong second half of 2025, the analyst tells investors in a research note.
BMO Capital
Outperform
maintain
$21 -> $26
2025-08-08
Reason
BMO Capital
Price Target
$21 -> $26
2025-08-08
maintain
Outperform
Reason
BMO Capital raised the firm's price target on Century Aluminum to $26 from $21 and keeps an Outperform rating on the shares. The company's Q2 EBITDA missed estimates, but earnings and free cash flow in Q3 are expected to improve materially as Century starts to benefit from the higher MWP - Midwest Aluminum Premium - prices, the analyst tells investors in a research note.
BMO Capital
Katja Jancic
Hold
to
Buy
Upgrades
$22
2025-02-24
Reason
BMO Capital
Katja Jancic
Price Target
$22
2025-02-24
Upgrades
Hold
to
Buy
Reason
See All Ratings

Valuation Metrics

The current forward P/E ratio for Century Aluminum Co (CENX.O) is 6.73, compared to its 5-year average forward P/E of 18.44. For a more detailed relative valuation and DCF analysis to assess Century Aluminum Co 's fair value, click here.
  • Forward PE
  • Forward EV/EBITDA
  • Forward PS

Forward PE

The forward P/E ratio is a valuation metric that divides a company's current stock price by its estimated future earnings per share over the next 12 months.
StronglyUndervaluedUndervaluedFairOvervaluedStronglyOvervalueddotted line Image
N/A
5Y Average PE
18.44
Current PE
6.73
Overvalued PE
258.16
Undervalued PE
-221.28

Forward EV/EBITDA

The forward EV/EBITDA ratio is a valuation metric that divides a company's enterprise value (EV) by its estimated future earnings before interest, taxes, depreciation, and amortization (EBITDA) over the next 12 months.
StronglyUndervaluedUndervaluedFairOvervaluedStronglyOvervalueddotted line Image
N/A
5Y Average EV/EBITDA
3.67
Current EV/EBITDA
0.00
Overvalued EV/EBITDA
19.73
Undervalued EV/EBITDA
-12.39

Forward PS

The forward P/S ratio is a valuation metric that divides a company's current stock price by its estimated future sales (or revenue) per share over the next 12 months.
StronglyUndervaluedUndervaluedFairOvervaluedStronglyOvervalueddotted line Image
N/A
5Y Average PS
0.56
Current PS
0.00
Overvalued PS
0.77
Undervalued PS
0.35
Financial AI Agent
Financial AI Agent

Financials

Annual
Quarterly
N/A
Total Revenue
N/A
Operating Profit
N/A
Net Income after Tax
N/A
EPS - Diluted
N/A
Free Cash Flow
N/A
Gross Profit Margin - %
N/A
FCF Margin - %
N/A
Net Margin - %
N/A
ROIC

Trading Trends

  • Insider
  • Hedge Fund
  • Congress Trading
Insider
Insiders areSelling! The selling amount has increased 37853.51% over the last month.
Sold
Bought
Hedge Fund
Hedge Funds areSelling! The selling amount has increased 1267.52% over the last quarter.
Sold
Bought
Congress Trading
Congress are Neutral. There are no significant trading trends over the last month.
Sold
Bought
Insider
Insiders areSelling! The selling amount has increased 37853.51% over the last month.
Sold
Bought
Intellectia AI SwingMax

CENX News & Events

Events Timeline

(ET)
2025-11-11
12:01:07
Century Aluminum Experiences a 14.9% Decline
select
2025-11-11
10:02:39
Century Aluminum Declines by 9.3%
select
2025-11-11
07:45:34
Century Aluminum Executes 9 Million Share Block Trade at $30.65 Each
select
Sign Up For More Events

News

[object Object]
Preview
9.5
11-13NASDAQ.COM
Century Aluminum Falls Short of Q3 Earnings and Revenue Projections
  • Century Aluminum Company Earnings: Century Aluminum reported third-quarter earnings of 15 cents per share, missing estimates and down from 46 cents in the prior year, despite a 17% year-over-year increase in net sales to $632.2 million.

  • Revenue and Shipment Details: The company's primary aluminum shipments decreased by 3.7% year-over-year, while cash and cash equivalents rose significantly to $151.4 million, with a forecasted adjusted EBITDA of $170 million to $180 million for Q4 2025.

  • Performance of Other Companies: The Middleby Corporation and Parker-Hannifin Corporation both exceeded earnings expectations for their respective quarters, with MIDD forecasting total sales between $3.85 to $3.89 billion and PH projecting a 4-7% sales increase year-over-year.

  • Market Trends: The demand for data is driving growth in the semiconductor market, with an under-the-radar chipmaker poised to benefit from this trend, as companies providing hardware for data centers are expected to thrive in the evolving digital landscape.

[object Object]
Preview
2.0
11-11Benzinga
Outset Medical, Gemini Space Station, CoreWeave, and Other Major Stocks Decline in Tuesday's Pre-Market Trading
  • U.S. Stock Futures: U.S. stock futures are mostly lower, with S&P 500 futures down approximately 0.2% on Tuesday morning.

  • Outset Medical's Financial Results: Outset Medical Inc. shares fell 25.8% in pre-market trading after reporting a quarterly loss of 69 cents per share, missing analyst expectations, and lowering its FY25 sales guidance.

  • Other Stocks Declining: Several other companies also saw declines in pre-market trading, including Gemini Space Station Inc. (-9.7%), CoreWeave Inc. (-9.2%), and Beyond Meat Inc. (-6%).

  • Market Reactions: The overall market is reacting negatively to various earnings reports, with multiple stocks experiencing significant drops following disappointing financial results.

[object Object]
Preview
5.0
11-11SeekingAlpha
Century Aluminum plummets following Glencore's $275M stake divestment
  • Shareholder Activity: Century Aluminum's largest shareholder, Glencore, sold 9 million shares at $30.65 each, leading to a 13.8% drop in Century Aluminum's stock price.

  • Financial Impact: The sale raised $275.9 million in gross proceeds and represented a 9.6% stake in Century Aluminum, which had previously seen a 14% increase in share price following its Q3 results.

Sign Up For More News

People Also Watch

FAQ

arrow icon

What is Century Aluminum Co (CENX) stock price today?

The current price of CENX is 30.86 USD — it has decreased -0.26 % in the last trading day.

arrow icon

What is Century Aluminum Co (CENX)'s business?

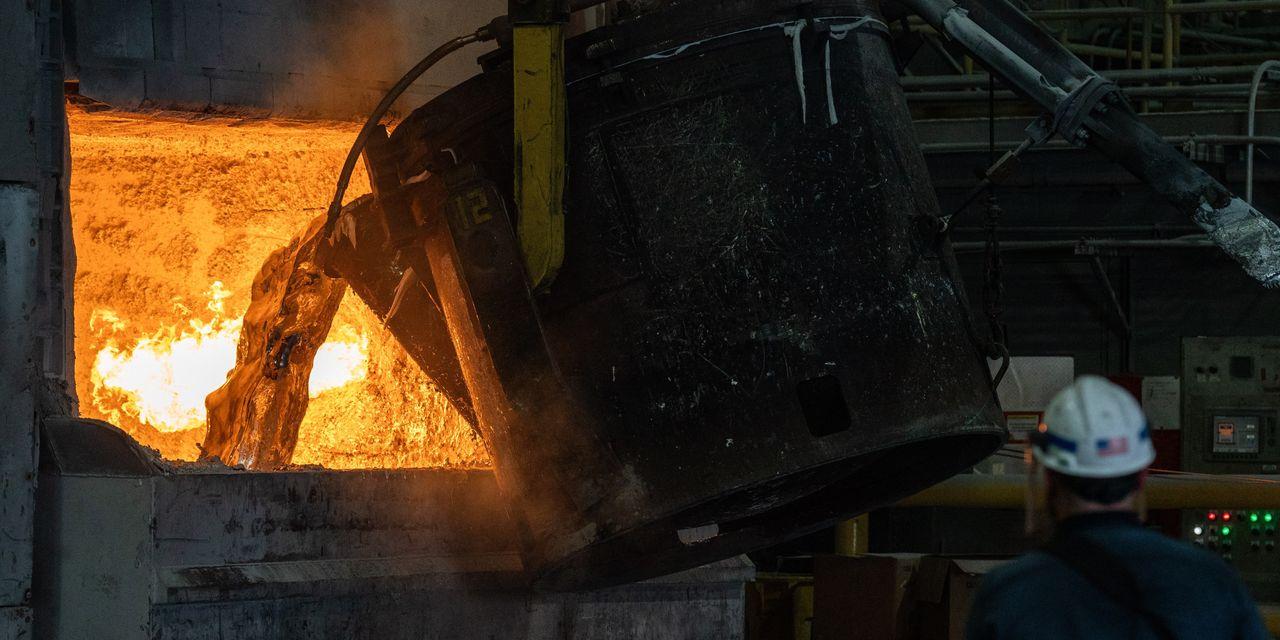
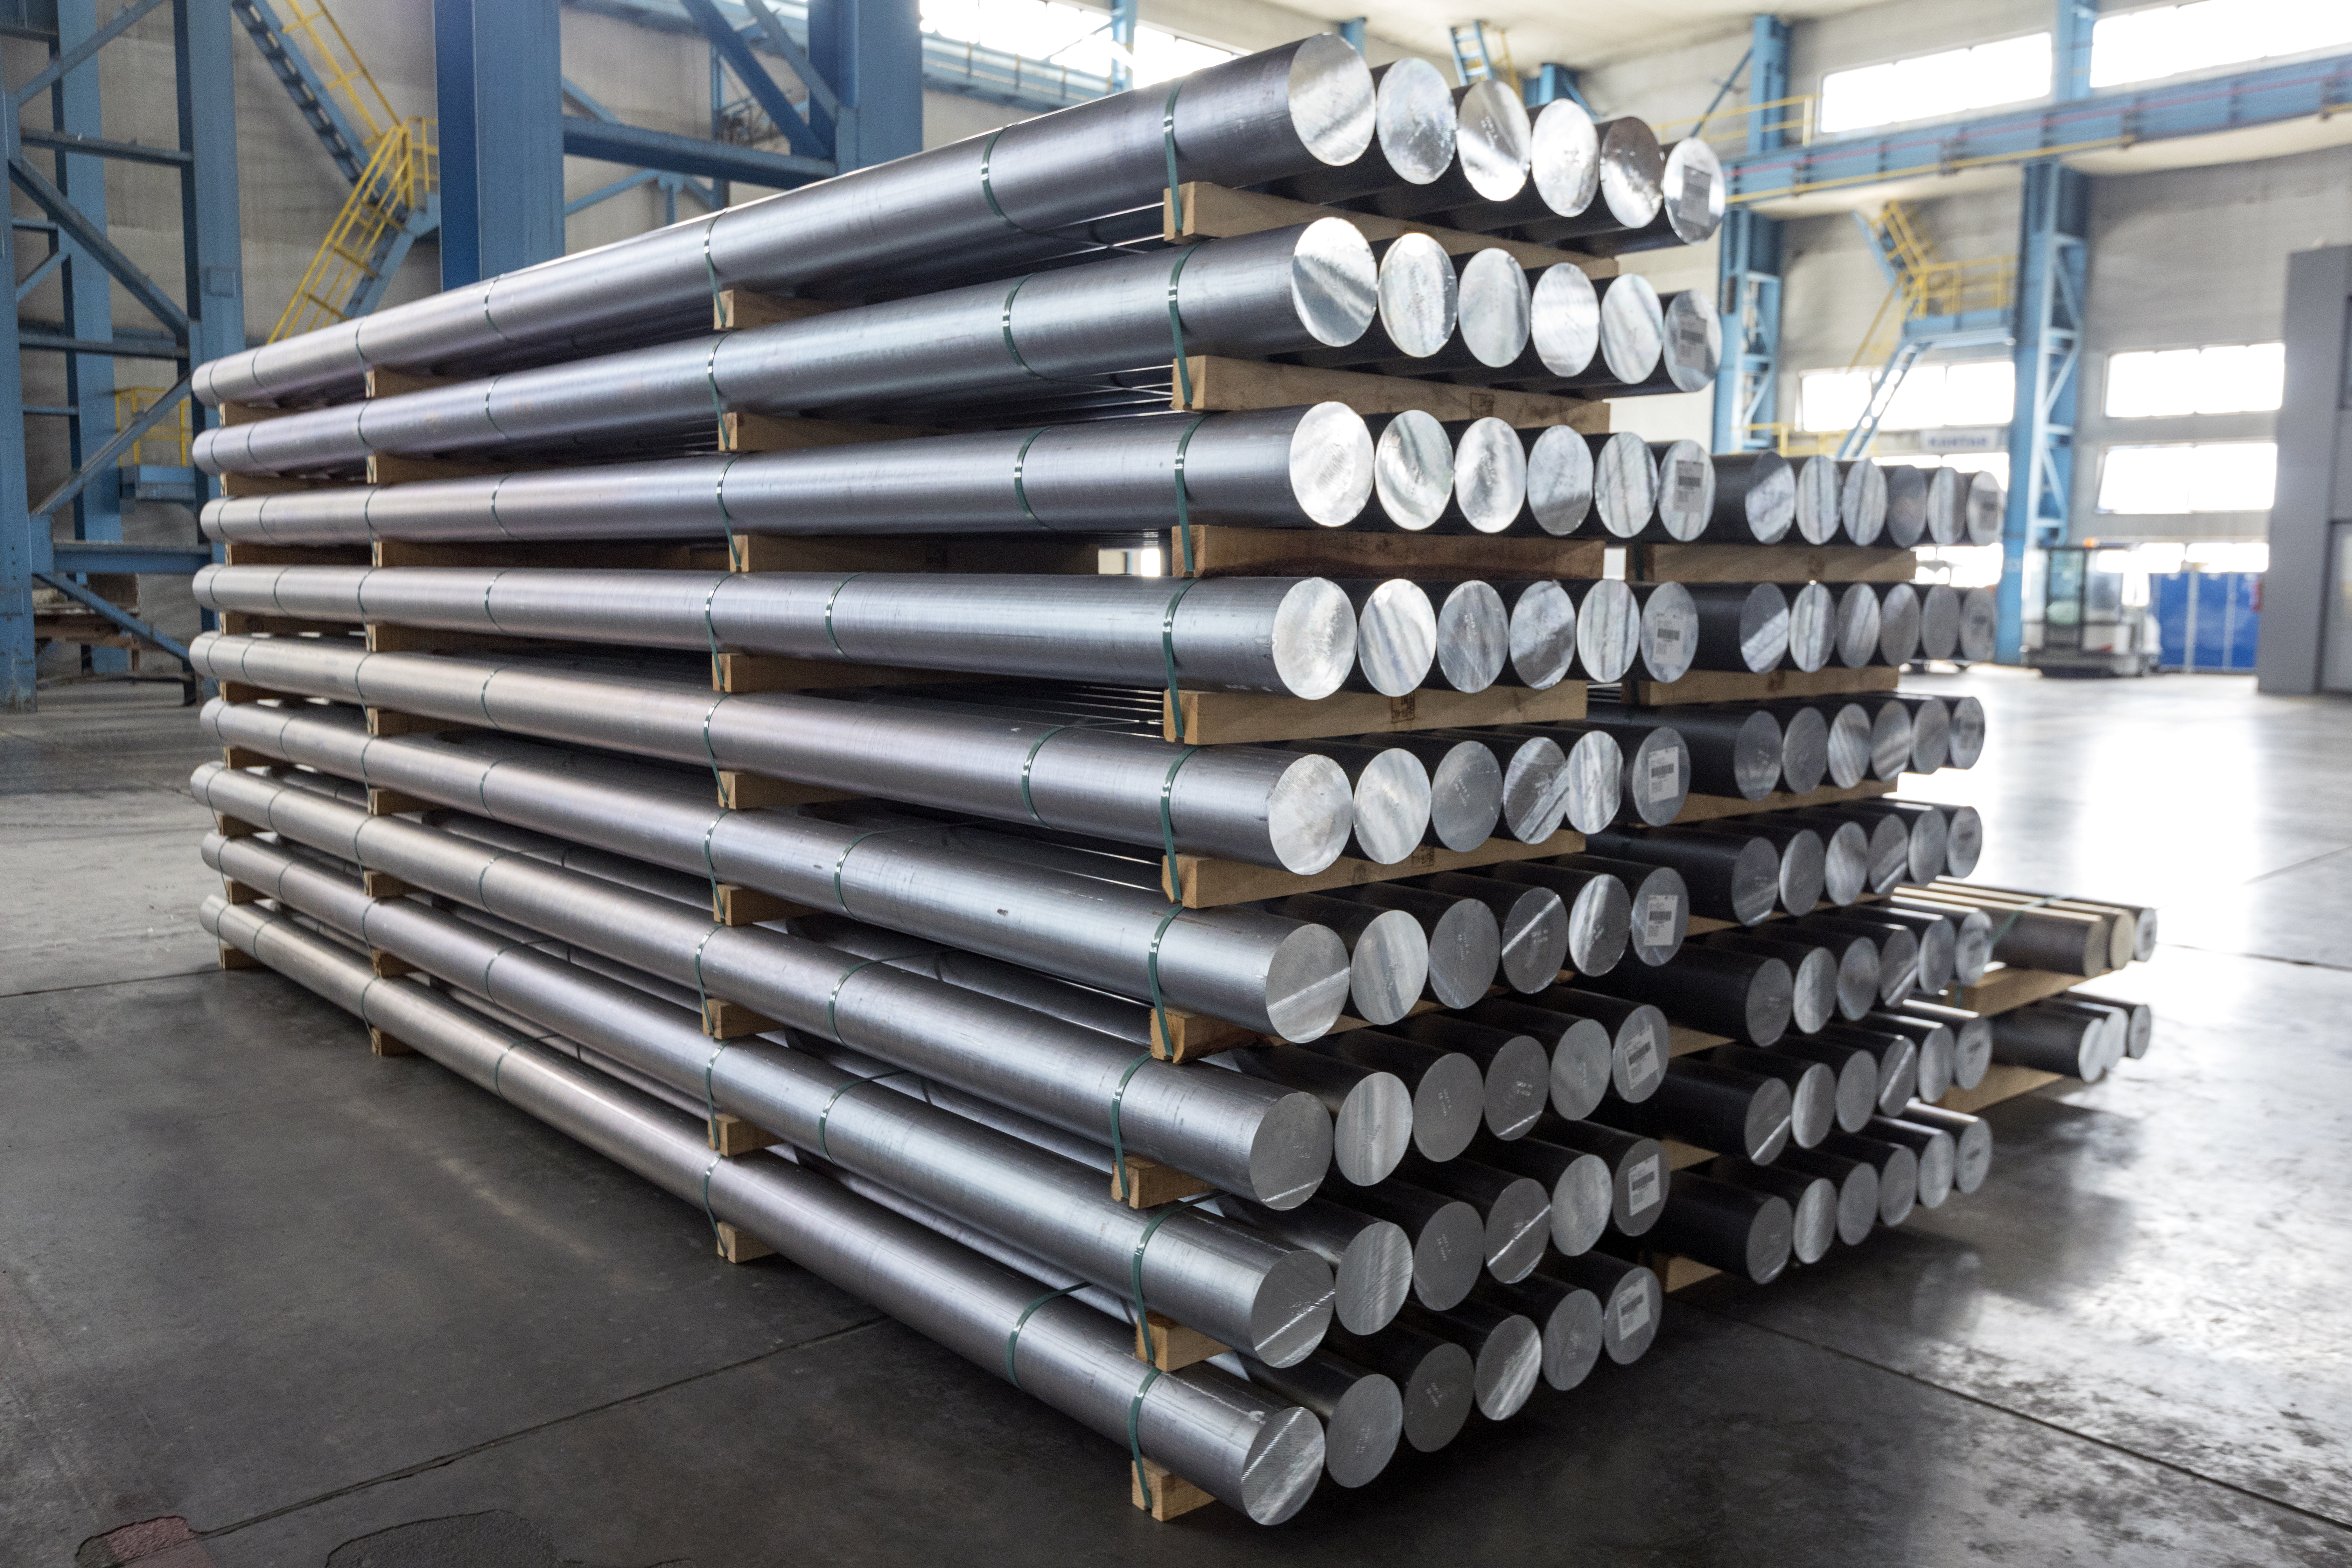
Century Aluminum Company is a global producer of primary aluminum and operates aluminum reduction facilities, or smelters. The Company's annual production capacity is approximately 1,020,000 tons per year (tpy). It owns a carbon anode production facility located in the Netherlands (Vlissingen). Carbon anodes are consumed in the production of primary aluminum. Vlissingen supplies carbon anodes to its aluminum smelter in Grundartangi, Iceland. Each of its aluminum smelters in the United States produces anodes at on-site facilities. Through its Natur-Al product line, it provides low-carbon aluminum products. It operates three United States aluminum smelters, in Hawesville, Kentucky (Hawesville), Robards, Kentucky (Sebree) and Goose Creek, South Carolina (Mt. Holly), and one aluminum smelter in Grundartangi, Iceland (Grundartangi). The Grundartangi facility, is an aluminum reduction facility owned and operated by the Company’s wholly owned subsidiary, Nordural Grundartangi ehf.

arrow icon

What is the price predicton of CENX Stock?

Wall Street analysts forecast CENX stock price to rise over the next 12 months. According to Wall Street analysts, the average 1-year price target for CENX is 32.00 USD with a low forecast of 28.00 USD and a high forecast of 34.00 USD. However, analyst price targets are subjective and often lag stock prices, so investors should focus on the objective reasons behind analyst rating changes, which better reflect the company's fundamentals.

arrow icon

What is Century Aluminum Co (CENX)'s revenue for the last quarter?

Century Aluminum Co revenue for the last quarter amounts to 632.20M USD, increased 17.27 % YoY.

arrow icon

What is Century Aluminum Co (CENX)'s earnings per share (EPS) for the last quarter?

Century Aluminum Co. EPS for the last quarter amounts to 0.14 USD, decreased -69.57 % YoY.

arrow icon

What changes have occurred in the market's expectations for Century Aluminum Co (CENX)'s fundamentals?

The market is revising Downward the revenue expectations for Century Aluminum Company (CENX) for FY2025, with the revenue forecasts being adjusted by -0.78% over the past three months. During the same period, the stock price has changed by 39.70%.
arrow icon

How many employees does Century Aluminum Co (CENX). have?

Century Aluminum Co (CENX) has 2971 emplpoyees as of December 05 2025.

arrow icon

What is Century Aluminum Co (CENX) market cap?

Today CENX has the market capitalization of 2.88B USD.

Intellectia LogoIntellectiaIntellectia LogoIntellectia

Redefine Your Investment Decisions

TwitterTwitterYoutubeYoutubeQuoraQuoraDiscordDiscordLinkedinLinkedinTelegramTelegram
AppStoreGooglePlay

Copyright © 2025 Intellectia.AI. All Rights Reserved.

pci certified logo
Company
HomeContactAbout UsNews Release
Compare
TradingViewSeeking Alpha
Features
Financial AI AgentStock Technical AnalysisStock MonitorHedge Fund TrackerAI ScreenerDaytrading Center
Strategies
AI Stock PickerSwing TradingStock Chart PatternsEarnings TradingDaytrading CenterAI Earnings PredictionQuant AIWhales Auto TrackerBacktesting Playground
Free Tools
Dividend CalculatorDividend Yield CalculatorOptions Profit Calculator
Resource
BlogTutorialEarningsTrending StocksCrypto MarketPartner ProgramTerms of UsePrivacy PolicySecuritySitemap
Start for Free