
MTZ
MasTec Inc
- Overview
- Forecast
- Valuation
- Earnings

Line
|

Candle
1D
5D
1M
3M
6M
YTD
1Y
5Y
High
180.970
Open
180.595
VWAP
180.44
Vol
22.65K
Mkt Cap
14.13B
Low
179.110
Amount
4.09M
EV/EBITDA(TTM)
16.21
Total Shares
79.46M
EV
16.26B
EV/OCF(TTM)
19.51
P/S(TTM)
1.08
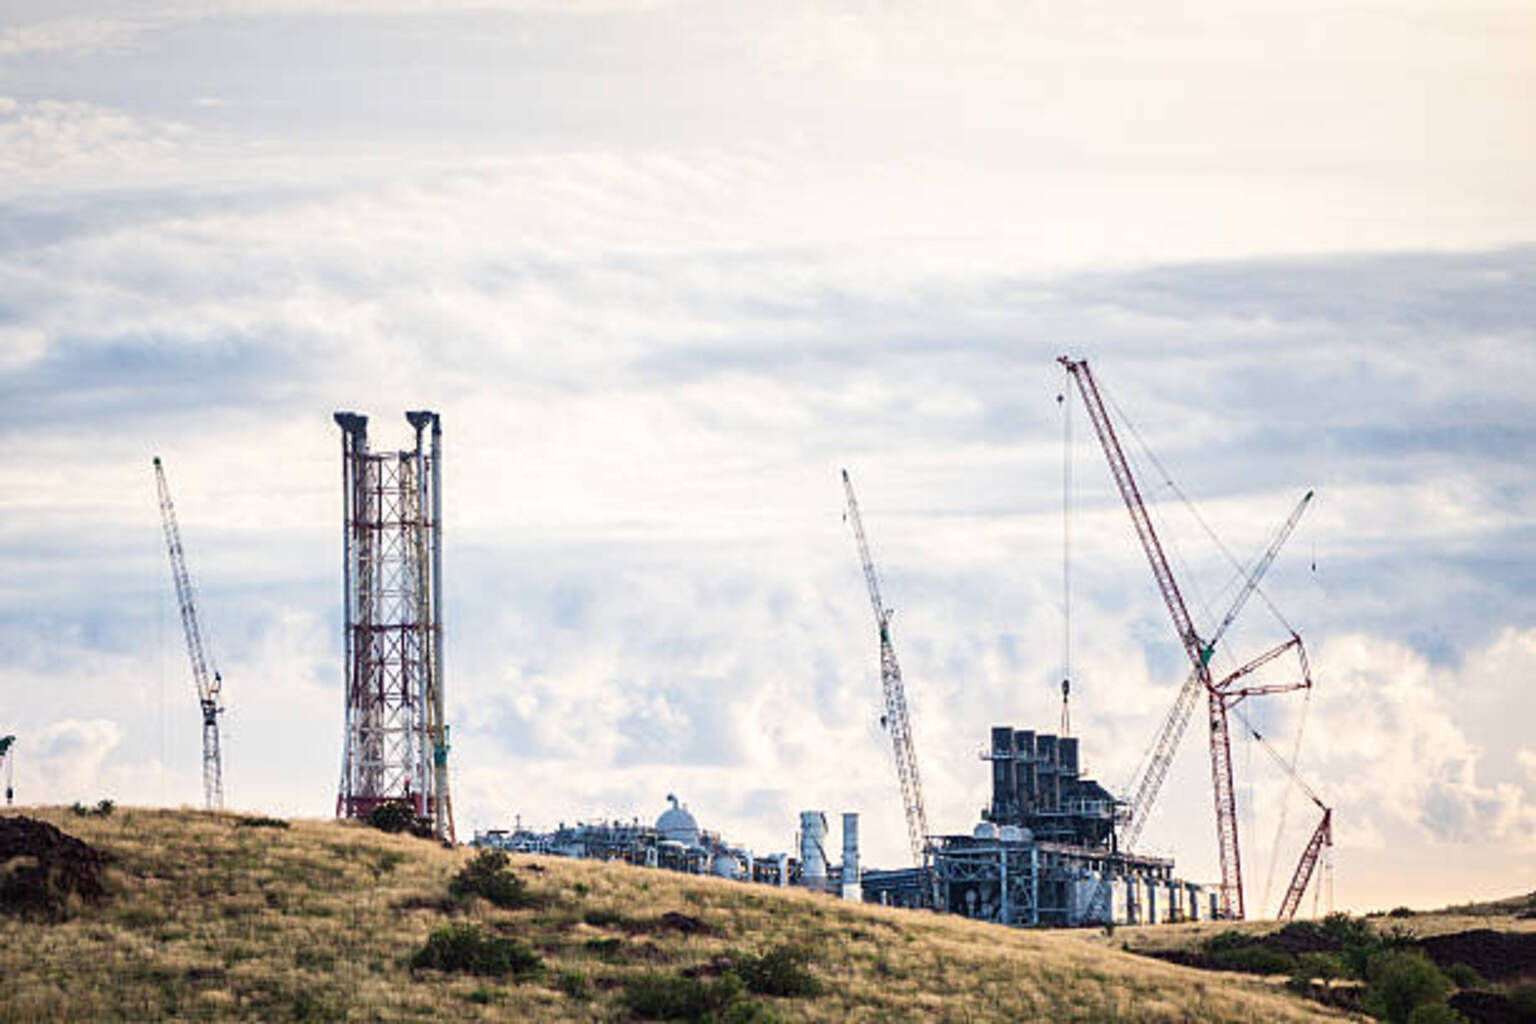
MasTec, Inc. is an infrastructure construction company operating mainly throughout North America across a range of industries. The Company's segments include Communications, Clean Energy and Infrastructure, Power Delivery, Pipeline Infrastructure, and Other. Communications segment performs engineering, construction, maintenance and customer fulfillment activities related to communications infrastructure, primarily for wireless and wireline/fiber communications, wireless integration and optimization and install-to-the-home services, and others. Clean Energy and Infrastructure segment primarily serves energy, utility, government and other end-markets through the installation and construction of power generation facilities, primarily from clean energy and renewable sources, such as wind, solar, and hydrogen; various types of heavy civil and industrial infrastructure services, and others. Power Delivery segment primarily serves the energy, utility and data center infrastructure industries.
Show More
Market Estimates
Earnings Estimates
Revenue
YoY Chg
EPS
YoYChg
FY2026Q1
FY2025Q4
FY2025Q3
3.17B
+11.34%
0.698
+36.78%
3.68B
+8.23%
2.037
+41.44%
3.90B
+19.97%
2.299
+41.02%
Estimates Revision
The market is revising Upward the revenue expectations for MasTec, Inc. (MTZ) for FY2025, with the revenue forecasts being adjusted by 2.17% over the past three months. During the same period, the stock price has changed by 17.71%.
Revenue Estimates for FY2025
Revise Upward

+2.17%
In Past 3 Month
EPS Estimates for FY2025
Revise Downward

-0.03%
In Past 3 Month
Stock Price
Go Up

+17.71%
In Past 3 Month
13 Analyst Rating

12.31% Upside
Wall Street analysts forecast MTZ stock price to rise over the next 12 months. According to Wall Street analysts, the average 1-year price target for MTZ is 201.92 USD with a low forecast of 156.00 USD and a high forecast of 219.00 USD. However, analyst price targets are subjective and often lag stock prices, so investors should focus on the objective reasons behind analyst rating changes, which better reflect the company's fundamentals.
13 Buy
0 Hold
0 Sell
Strong Buy

12.31% Upside
Current: 179.790

Low
156.00
Averages
201.92
High
219.00

12.31% Upside
Current: 179.790

Low
156.00
Averages
201.92
High
219.00
Baird
Baird
Neutral -> Outperform
upgrade
$180 -> $210
2025-08-04
Reason
Baird
Baird
Price Target
$180 -> $210
2025-08-04
upgrade
Neutral -> Outperform
Reason
Baird upgraded MasTec to Outperform from Neutral with a price target of $210, up from $180. While the company's Q2 report wasn't great, the post-earnings selloff is overdone, the analyst tells investors in a research note. The firm says the quarter was pressured by broader market weakness and that its estimates are largely unchanged. MasTec's 2026 earnings power looks intact and most of the company's markets are showing good gains, contends Baird.
Citi
Buy
maintain
$220 -> $219
2025-08-04
Reason
Citi
Price Target
$220 -> $219
2025-08-04
maintain
Buy
Reason
Citi lowered the firm's price target on MasTec to $219 from $220 and keeps a Buy rating on the shares. The firm views the post-earning selloff in the shares as "somewhat overdone" since MasTec beat earnings estimates and upped its 2025 outlook.
DA Davidson
Buy
maintain
$170 -> $210
2025-08-04
Reason
DA Davidson
Price Target
$170 -> $210
2025-08-04
maintain
Buy
Reason
DA Davidson raised the firm's price target on MasTec to $210 from $170 and keeps a Buy rating on the shares after its Q2 earnings beat. The company's broader business momentum is evident with expectations for further backlog gains, and the firm is positive on MasTec's broader leverage to today's energy conundrum as well as its capabilities to support enhancement of data communications, the analyst tells investors in a research note.
Stifel
Brian Brophy
Buy
maintain
$181 -> $198
2025-08-04
Reason
Stifel
Brian Brophy
Price Target
$181 -> $198
2025-08-04
maintain
Buy
Reason
Stifel analyst Brian Brophy raised the firm's price target on MasTec to $198 from $181 and keeps a Buy rating on the shares. Q2 results largely exceeded expectations, Q3 guidance was above expectations and 2025 guidance was broadly raised, notes the analyst, who views the post-earnings dip as "a buying opportunity."
KeyBanc
Sangita Jain
Overweight
maintain
$196 -> $205
2025-08-04
Reason
KeyBanc
Sangita Jain
Price Target
$196 -> $205
2025-08-04
maintain
Overweight
Reason
KeyBanc analyst Sangita Jain raised the firm's price target on MasTec to $205 from $196 and keeps an Overweight rating on the shares. The firm reported strong Q2, raised 2025 by more than the beat, and outlined strong growth drivers in each of its end markets. Yet, shares underperformed. KeyBanc thinks the reason was the 0.9-times BTB and LDD margin in Pipelines, but it doesn't get the hand wringing over what appears to be a timing issue and management telegraphing increasing headcount by over 10% in Q2 to support growth.
Truist
Buy
maintain
$184 -> $209
2025-08-04
Reason
Truist
Price Target
$184 -> $209
2025-08-04
maintain
Buy
Reason
Truist raised the firm's price target on MasTec to $209 from $184 and keeps a Buy rating on the shares. The company printed another solid quarter with revenues growing 20% y/y and 24% sequentially to $3.5B, the analyst tells investors in a research note. MasTec continues to make progress diversifying its earnings stream with non-pipeline revenues increasing 26% y/y with an adjusted EBITDA growth of 42%, the firm added.
See All Ratings
Valuation Metrics
The current forward P/E ratio for MasTec Inc (MTZ.N) is 25.93, compared to its 5-year average forward P/E of 23.94. For a more detailed relative valuation and DCF analysis to assess MasTec Inc 's fair value, click here.
Forward PE
The forward P/E ratio is a valuation metric that divides a company's current stock price by its estimated future earnings per share over the next 12 months.

Fair
5Y Average PE
23.94
Current PE
25.93
Overvalued PE
33.41
Undervalued PE
14.47
Forward EV/EBITDA
The forward EV/EBITDA ratio is a valuation metric that divides a company's enterprise value (EV) by its estimated future earnings before interest, taxes, depreciation, and amortization (EBITDA) over the next 12 months.

Overvalued
5Y Average EV/EBITDA
9.70
Current EV/EBITDA
13.34
Overvalued EV/EBITDA
11.64
Undervalued EV/EBITDA
7.75
Forward PS
The forward P/S ratio is a valuation metric that divides a company's current stock price by its estimated future sales (or revenue) per share over the next 12 months.

Overvalued
5Y Average PS
0.65
Current PS
0.97
Overvalued PS
0.81
Undervalued PS
0.49
Financials
Annual
Quarterly
FY2025Q2
YoY :
+19.71%
3.54B
Total Revenue
FY2025Q2
YoY :
+32.29%
157.60M
Operating Profit
FY2025Q2
YoY :
+105.93%
90.13M
Net Income after Tax
FY2025Q2
YoY :
+153.49%
1.09
EPS - Diluted
FY2025Q2
YoY :
-124.97%
-58.17M
Free Cash Flow
FY2025Q2
YoY :
-2.39%
9.39
Gross Profit Margin - %
FY2025Q2
YoY :
-42.70%
4.83
FCF Margin - %
FY2025Q2
YoY :
+71.62%
2.54
Net Margin - %
FY2025Q2
5.03
ROIC
Trading Trends
Insider
Insiders are Neutral. There are no significant trading trends over the last month.
Sold
0-3
Months
3.6M
USD
2
3-6
Months
1.1M
USD
3
6-9
Months
28.6K
USD
1
0-12
Months
8.0M
USD
9
Bought
0-3
0
0.0
USD
Months
3-6
0
0.0
USD
Months
6-9
0
0.0
USD
Months
0-12
0
0.0
USD
Months
Hedge Fund
Hedge Funds are Neutral. There are no significant trading trends over the last quarter.
Sold
0-3
Months
0.0
Volume
0
3-6
Months
562.5K
Volume
3
6-9
Months
1.0M
Volume
5
0-12
Months
0.0
Volume
0
Bought
0-3
0
0.0
Volume
Months
3-6
6
1.2M
Volume
Months
6-9
10
862.8K
Volume
Months
0-12
0
0.0
Volume
Months
Congress Trading
Congress are Neutral. There are no significant trading trends over the last month.
Sold
0-3
Months
0.0
USD
0
3-6
Months
0.0
USD
0
6-9
Months
0.0
USD
0
0-12
Months
0.0
USD
0
Bought
0-3
0
0.0
USD
Months
3-6
0
0.0
USD
Months
6-9
2
40.5K
USD
Months
0-12
0
0.0
USD
Months
Insider
Insiders are Neutral. There are no significant trading trends over the last month.
Sold
0-3
Months
3.6M
USD
2
3-6
Months
1.1M
USD
3
6-9
Months
28.6K
USD
1
0-12
Months
8.0M
USD
9
Bought
0-3
0
0.0
USD
Months
3-6
0
0.0
USD
Months
6-9
0
0.0
USD
Months
0-12
0
0.0
USD
Months
MTZ News & Events
Events Timeline
2025-07-31 (ET)
2025-07-31
16:24:19
MasTec reports Q2 EPS $1.49, consensus $1.40

2025-05-01 (ET)
2025-05-01
16:37:15
MasTec sees Q2 adjusted EPS $1.36-$1.46, consensus $1.42

2025-05-01
16:36:59
MasTec raises FY25 adjusted EPS view to $5.90-$6.25 from $5.35-$5.84

Sign Up For More Events
News
4.0
08-07BenzingaBreaking Down MasTec: 13 Analysts Share Their Views
6.5
08-07NASDAQ.COMLook Under The Hood: IWF Has 10% Upside
9.5
08-05NASDAQ.COMMasTec (MTZ) Q2 2025 Earnings Call Transcript
Sign Up For More News
People Also Watch

FUTU
Futu Holdings Ltd
163.350
USD
+2.41%

CIEN
Ciena Corp
94.640
USD
+1.35%

KMX
Carmax Inc
56.550
USD
+1.09%

RTO
Rentokil Initial PLC
25.130
USD
0.00%

PAYC
Paycom Software Inc
221.580
USD
+0.24%

UHS
Universal Health Services Inc
172.800
USD
+0.66%

TECH
Bio-Techne Corp
50.150
USD
0.00%

COKE
Coca-Cola Consolidated Inc
115.050
USD
+0.40%

CHRW
CH Robinson Worldwide Inc
116.240
USD
0.00%

WPC
WP Carey Inc
65.600
USD
0.00%
FAQ

What is MasTec Inc (MTZ) stock price today?
The current price of MTZ is 179.79 USD — it has increased 0.41 % in the last trading day.

What is MasTec Inc (MTZ)'s business?

What is the price predicton of MTZ Stock?

What is MasTec Inc (MTZ)'s revenue for the last quarter?

What is MasTec Inc (MTZ)'s earnings per share (EPS) for the last quarter?

What changes have occurred in the market's expectations for MasTec Inc (MTZ)'s fundamentals?

How many employees does MasTec Inc (MTZ). have?
