Intellectia LogoIntellectia
Product
Resources
Markets
News
Partner Program
Pricing
Log inTry for Free
Intellectia Logo
Log in
Intellectia Logo

Product

Features
Financial AI Agent
Stock Technical Analysis
Stock Monitor
Hedge Fund Tracker
AI Screener
Trading Strategies
AI Stock Picker
Swing Trading
Quant AI
Stock Chart Patterns
Daytrading Center
AI Earnings Prediction
Whales Auto Tracker
Backtesting Playground

Resources

Learn
Blog
Earnings
Tutorial
Help Center
Company
About Us
Contact
Press
Reward Program
Partner Program
Tools
Dividend Calculator
Dividend Yield Calculator
Options Profit Calculator
Compare
TradingView
SeekingAlpha

Markets

Trending Stocks
Hot Crypto
Trending News
All Stocks

News

Trading News
Overview
Top News
Daily Market Brief
Earnings
Latest
Newswire
Stock News
Crypto News
Monitor News
Partner ProgramPricing
Start for Free
  1. Home
  2. >
  3. Stock
  4. >
  5. GLDG
stocks logo

GLDG

-
collectAdd to Watchlistadvanced chartAdvanced Chart
$
0.000
0(0.000%)1D
collectadvanced chart
    Overview
    Forecast
    Valuation
    Earnings
High
--
Open
--
VWAP
--
Vol
--
Mkt Cap
--
Low
--
Amount
--
EV/EBITDA(TTM)
--
Total Shares
--
EV
--
EV/OCF(TTM)
--
P/S(TTM)
--
AI Stock Picker
AI Stock Picker

Market Estimates

Earnings Estimates
Earnings Estimates
Revenue
YoY Chg
EPS
YoYChg
FY2025Q3
--
--
-0.030
-40%
Estimates Revision
Stock Price
Go Up
up Image
+28.18%
In Past 3 Month
Wall Street analysts forecast GLDG stock price to rise over the next 12 months. According to Wall Street analysts, the average 1-year price target for GLDG is 3.75 USD with a low forecast of 3.75 USD and a high forecast of 3.75 USD. However, analyst price targets are subjective and often lag stock prices, so investors should focus on the objective reasons behind analyst rating changes, which better reflect the company's fundamentals.
1 Analyst Rating
Wall Street analysts forecast GLDG stock price to rise over the next 12 months. According to Wall Street analysts, the average 1-year price target for GLDG is 3.75 USD with a low forecast of 3.75 USD and a high forecast of 3.75 USD. However, analyst price targets are subjective and often lag stock prices, so investors should focus on the objective reasons behind analyst rating changes, which better reflect the company's fundamentals.
1 Buy
0 Hold
0 Sell
Moderate Buy
Current: 1.410
sliders
Low
3.75
Averages
3.75
High
3.75
Current: 1.410
sliders
Low
3.75
Averages
3.75
High
3.75
H.C. Wainwright
Buy
maintain
2025-09-29
Reason
H.C. Wainwright
Price Target
2025-09-29
maintain
Buy
Reason
H.C. Wainwright raised the firm's price target on GoldMining to $3.75 from $3.25 and keeps a Buy rating on the shares. The firm cites a high valuation of the the company's equity holdings for the target increase.
HC Wainwright & Co.
Heiko Ihle
Strong Buy
Reiterates
$3.25
2025-04-15
Reason
HC Wainwright & Co.
Heiko Ihle
Price Target
$3.25
2025-04-15
Reiterates
Strong Buy
Reason
HC Wainwright & Co.
Heiko Ihle
Strong Buy
Maintains
$5.5 → $3.25
2025-02-28
Reason
HC Wainwright & Co.
Heiko Ihle
Price Target
$5.5 → $3.25
2025-02-28
Maintains
Strong Buy
Reason
HC Wainwright & Co.
Heiko Ihle
Strong Buy
Maintains
$5.25 → $5.5
2024-12-05
Reason
HC Wainwright & Co.
Heiko Ihle
Price Target
$5.25 → $5.5
2024-12-05
Maintains
Strong Buy
Reason
See All Ratings

Valuation Metrics

The current forward P/E ratio for GoldMining Inc (GLDG.A) is -16.39, compared to its 5-year average forward P/E of -12.05. For a more detailed relative valuation and DCF analysis to assess GoldMining Inc 's fair value, click here.
  • Forward PE
  • Forward EV/EBITDA
  • Forward PS

Forward PE

The forward P/E ratio is a valuation metric that divides a company's current stock price by its estimated future earnings per share over the next 12 months.
StronglyUndervaluedUndervaluedFairOvervaluedStronglyOvervalueddotted line Image
N/A
5Y Average PE
-12.05
Current PE
-16.39
Overvalued PE
0.83
Undervalued PE
-24.93

Forward EV/EBITDA

The forward EV/EBITDA ratio is a valuation metric that divides a company's enterprise value (EV) by its estimated future earnings before interest, taxes, depreciation, and amortization (EBITDA) over the next 12 months.
StronglyUndervaluedUndervaluedFairOvervaluedStronglyOvervalueddotted line Image
N/A
5Y Average EV/EBITDA
-15.58
Current EV/EBITDA
0.00
Overvalued EV/EBITDA
3.11
Undervalued EV/EBITDA
-34.27

Forward PS

The forward P/S ratio is a valuation metric that divides a company's current stock price by its estimated future sales (or revenue) per share over the next 12 months.
StronglyUndervaluedUndervaluedFairOvervaluedStronglyOvervalueddotted line Image
N/A
5Y Average PS
0.00
Current PS
0.00
Overvalued PS
0.00
Undervalued PS
0.00
Financial AI Agent
Financial AI Agent

Financials

Annual
Quarterly
N/A
Operating Profit
N/A
Net Income after Tax
N/A
EPS - Diluted
N/A
Free Cash Flow
N/A
ROIC

Trading Trends

  • Insider
  • Hedge Fund
  • Congress Trading
Insider
Insiders are Neutral. There are no significant trading trends over the last month.
Sold
Bought
Hedge Fund
Hedge Funds are Neutral. There are no significant trading trends over the last quarter.
Sold
Bought
Congress Trading
Congress are Neutral. There are no significant trading trends over the last month.
Sold
Bought
Insider
Insiders are Neutral. There are no significant trading trends over the last month.
Sold
Bought
Intellectia AI SwingMax

GLDG News & Events

Events Timeline

(ET)
2025-08-28
08:14:56
NevGold reveals agreement to enter standstill with GoldMining.
select
2025-05-01 (ET)
2025-05-01
06:31:22
GoldMining announces Rea Uranium Project application approved
select
Sign Up For More Events

News

[object Object]
Preview
9.5
10-28Benzinga
Celestica Shares Rise Approximately 8%; 20 Stocks Making Moves in Premarket Trading
  • Celestica's Strong Performance: Celestica Inc. reported better-than-expected Q3 earnings of $1.58 per share and revenue of $3.19 billion, leading to an 8.3% increase in its stock price during pre-market trading.

  • Notable Gainers: Several stocks saw significant pre-market gains, including TEN Holdings (up 89.2%), Freight Technologies (up 65.1%), and Reliance Global Group (up 48%) after completing a purchase and announcing a dividend.

  • Major Losers: Co-Diagnostics experienced a 13.5% drop in pre-market trading following a previous surge, while Rambus Inc. fell 14.3% after disappointing quarterly earnings.

  • Market Overview: The article highlights various stocks moving in pre-market trading, showcasing both significant gainers and losers, reflecting the volatility and reactions to recent company announcements.

[object Object]
Preview
4.0
09-29Benzinga
HC Wainwright & Co. Reaffirms Buy Rating on GoldMining, Increases Price Target to $3.75
  • Real-time Intelligence: Benzinga Pro offers the fastest news alerts to help traders stay informed and make timely decisions in the stock market.

  • Community and Exclusivity: Joining Benzinga Pro connects users with over 10,000 serious traders and provides access to exclusive stories and insights from Benzinga reporters.

[object Object]
Preview
5.0
08-26Yahoo Finance
GoldMining Submits Early Warning Report
  • Share Disposition: GoldMining Inc. has disposed of 1,500,000 common shares of NevGold Corp., reducing its ownership from approximately 21.1% to 19.8% of the outstanding shares.

  • Early Warning Report: An early warning report will be filed by GoldMining Inc. on SEDAR+ regarding this share disposition, providing further details.

  • Investment Strategy: The shares were sold for investment purposes, and GoldMining may adjust its holdings in the future based on market conditions and strategic plans.

  • Company Overview: GoldMining Inc. is focused on acquiring and developing gold assets across the Americas, holding a diversified portfolio that includes significant shares in various mining companies.

Sign Up For More News

People Also Watch

FAQ

arrow icon

What is GoldMining Inc (GLDG) stock price today?

The current price of GLDG is 1.41 USD — it has decreased -1.4 % in the last trading day.

arrow icon

What is GoldMining Inc (GLDG)'s business?

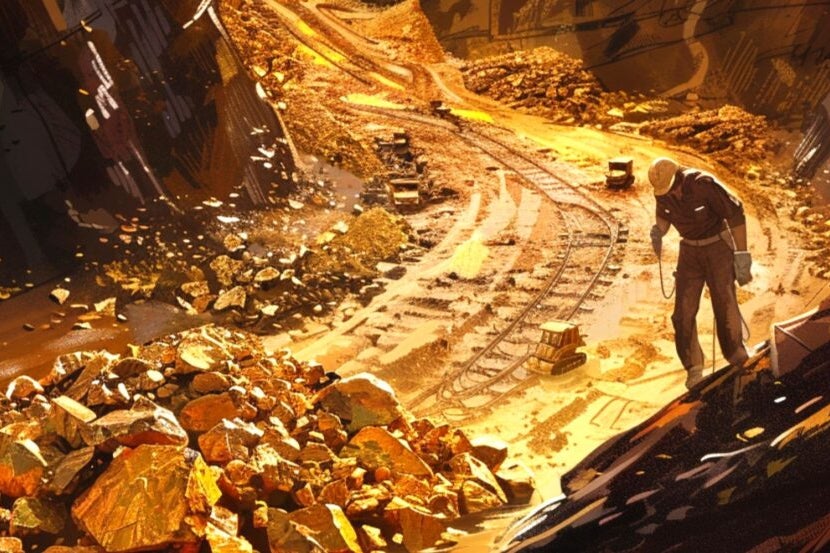
GoldMining Inc. is a mineral exploration company focused on acquiring and developing gold assets in the Americas. It controls a diversified portfolio of resource-stage gold and gold-copper projects in Canada, the United States, Brazil, Colombia, and Peru. Its projects include Titiribi, La Mina, Yellowknife, Crucero, Nutmeg Mountain, Sao Jorge, Cachoeira, Yarumalito, Surubim, Boa Vista, Batistao, Montes Aureos, and Trinta. The Titiribi project is a copper-gold exploration project located 51 km from Medellin, Colombia. The La Mina project comprises two concessions covering 3,208 hectares, located in the Department of Antioquia, Republic of Colombia. The Yellowknife Gold project is comprised of five properties: Ormsby - Bruce, Nicholas Lake, Goodwin Lake, Clan Lake, and Big Sky. Sao Jorge is a resource stage gold exploration project located 4 km west of the Cuiaba-Santarem Highway BR-163. The regional land package comprising of eight exploration permits totals 46,485 ha (464.85 km2).

arrow icon

What is the price predicton of GLDG Stock?

Wall Street analysts forecast GLDG stock price to rise over the next 12 months. According to Wall Street analysts, the average 1-year price target for GLDG is 3.75 USD with a low forecast of 3.75 USD and a high forecast of 3.75 USD. However, analyst price targets are subjective and often lag stock prices, so investors should focus on the objective reasons behind analyst rating changes, which better reflect the company's fundamentals.

arrow icon

What is GoldMining Inc (GLDG)'s revenue for the last quarter?

GoldMining Inc revenue for the last quarter amounts to -6.91M USD, decreased -13.91 % YoY.

arrow icon

What is GoldMining Inc (GLDG)'s earnings per share (EPS) for the last quarter?

GoldMining Inc. EPS for the last quarter amounts to -7620000.00 USD, decreased -6.86 % YoY.

arrow icon

What changes have occurred in the market's expectations for GoldMining Inc (GLDG)'s fundamentals?

The market is revising No Change the revenue expectations for GLDG for , with the revenue forecasts being adjusted by % over the past three months. During the same period, the stock price has changed by 28.18%.
arrow icon

How many employees does GoldMining Inc (GLDG). have?

GoldMining Inc (GLDG) has 33 emplpoyees as of December 05 2025.

arrow icon

What is GoldMining Inc (GLDG) market cap?

Today GLDG has the market capitalization of 294.01M USD.

Intellectia LogoIntellectiaIntellectia LogoIntellectia

Redefine Your Investment Decisions

TwitterTwitterYoutubeYoutubeQuoraQuoraDiscordDiscordLinkedinLinkedinTelegramTelegram
AppStoreGooglePlay

Copyright © 2025 Intellectia.AI. All Rights Reserved.

pci certified logo
Company
HomeContactAbout UsNews Release
Compare
TradingViewSeeking Alpha
Features
Financial AI AgentStock Technical AnalysisStock MonitorHedge Fund TrackerAI ScreenerDaytrading Center
Strategies
AI Stock PickerSwing TradingStock Chart PatternsEarnings TradingDaytrading CenterAI Earnings PredictionQuant AIWhales Auto TrackerBacktesting Playground
Free Tools
Dividend CalculatorDividend Yield CalculatorOptions Profit Calculator
Resource
BlogTutorialEarningsTrending StocksCrypto MarketPartner ProgramTerms of UsePrivacy PolicySecuritySitemap
Start for Free