ESTC Overview
-
$
0.000
0.000(0.000%)
At close0.000(0.000%)Aft-market
ET
Loading chart...

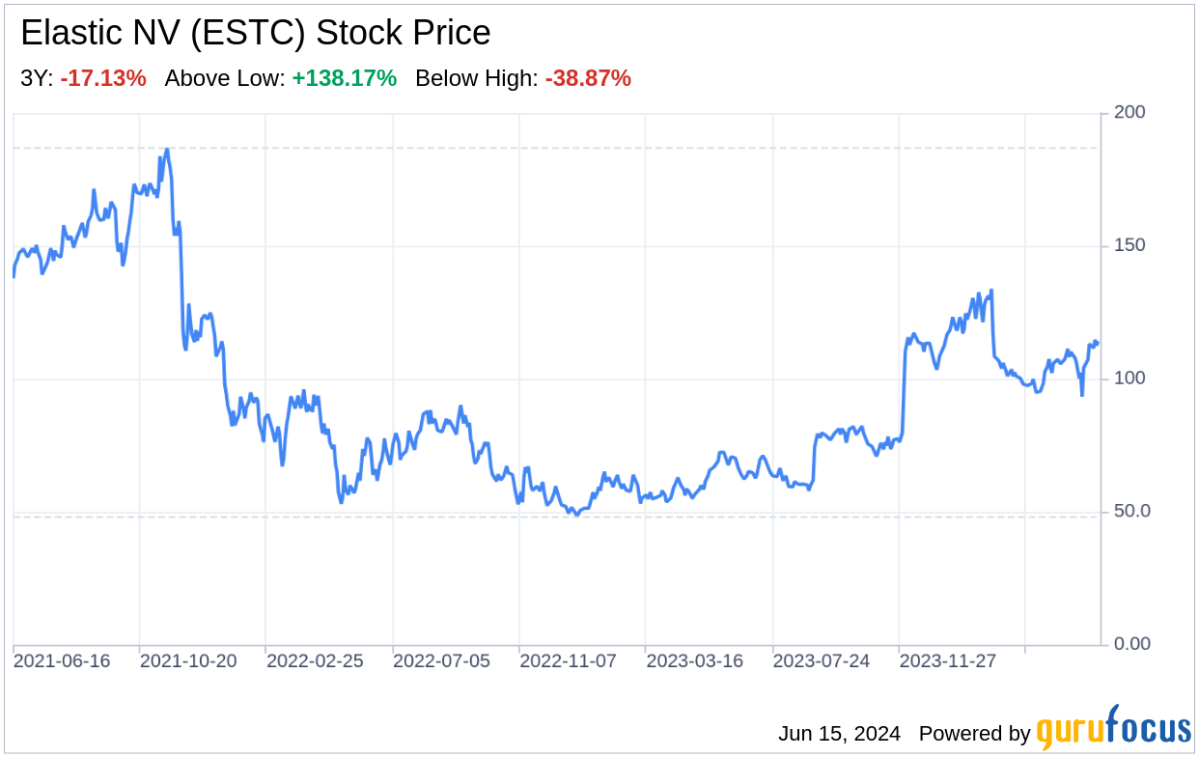
The current price of ESTC is 58.97 USD — it has increased 0.7
Elastic NV is a Netherlands-based data analytics company. The Company’s platform, which is available as both a hosted, managed service across public clouds as well as self-managed software, allows its customers to find insights from large amounts of data and take action. The Company offers three search-powered solutions - Enterprise Search, Observability, and Security - that are built into the platform, which is built on the Elastic Stack, a set of software products that ingest data from any source, in any format, and perform search, analysis, and visualization of that data. The Company helps organizations, their employees, and their customers find what they need, while keeping mission-critical applications running smoothly, and protecting against cyber threats. The Company generates revenue primarily from sales of subscriptions to its platform.
Wall Street analysts forecast ESTC stock price to rise over the next 12 months. According to Wall Street analysts, the average 1-year price target for ESTC is101.14 USD with a low forecast of 75.00 USD and a high forecast of 130.00 USD. However, analyst price targets are subjective and often lag stock prices, so investors should focus on the objective reasons behind analyst rating changes, which better reflect the company's fundamentals.
Elastic NV revenue for the last quarter amounts to 450.68M USD, increased 16.03
Elastic NV. EPS for the last quarter amounts to 3.90 USD, decreased -2537.50
Elastic NV (ESTC) has 4019 emplpoyees as of June 20 2026.
Today ESTC has the market capitalization of 6.13B USD.