BRBR Overview
-
$
0.000
0.000(0.000%)
At close0.000(0.000%)Aft-market
ET
Loading chart...

The current price of BRBR is 12.15 USD — it has decreased -7.81
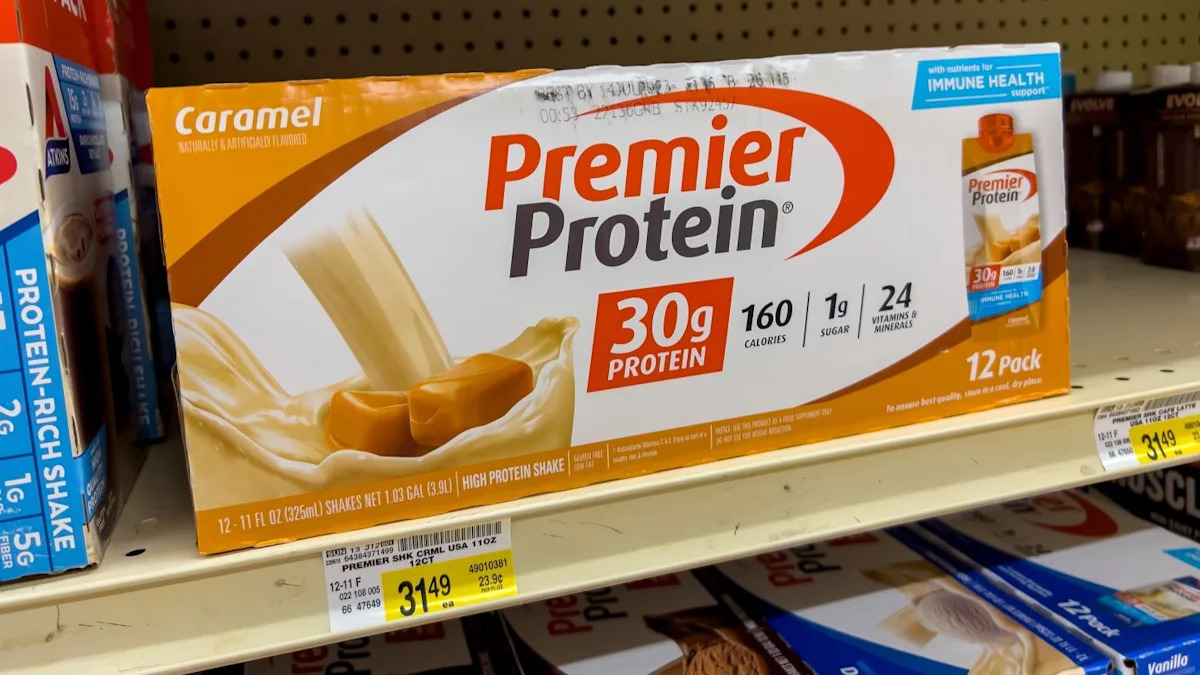
BellRing Brands, Inc. is a consumer products holding company operating in the global proactive wellness category. The Company's brands include Premier Protein, a ready-to-drink protein (RTD) and proactive wellness brand, and Dymatize, a hydrolyzed protein powder brand. The Company's products are distributed in over 90 countries across club, mass, food, e-commerce, specialty, drug and convenience. Premier Protein's product portfolio consists primarily of RTD protein shakes and protein powders. Premier Protein's flagship RTD protein shakes are available in diverse flavors and contain 30 grams of protein and 160 calories. Premier Protein's powder portfolio consists primarily of 100% whey protein products. Dymatize brand's portfolio includes an assortment of sports nutrition products, including protein powders. The Company's protein powder portfolio consists of three primary products: ISO.100 made with hydrolyzed 100% Whey Protein Isolate, Elite 100% Whey and Super Mass Gainer.
Wall Street analysts forecast BRBR stock price to rise over the next 12 months. According to Wall Street analysts, the average 1-year price target for BRBR is32.09 USD with a low forecast of 23.00 USD and a high forecast of 49.00 USD. However, analyst price targets are subjective and often lag stock prices, so investors should focus on the objective reasons behind analyst rating changes, which better reflect the company's fundamentals.
Bellring Brands Inc revenue for the last quarter amounts to 598.70M USD, increased 1.82
Bellring Brands Inc. EPS for the last quarter amounts to 0.29 USD, decreased -35.56
Bellring Brands Inc (BRBR) has 530 emplpoyees as of July 10 2026.
Today BRBR has the market capitalization of 1.53B USD.