BKE Overview
-
$
0.000
0.000(0.000%)
At close0.000(0.000%)Aft-market
ET
Loading chart...

The current price of BKE is 42.69 USD — it has increased 1.98
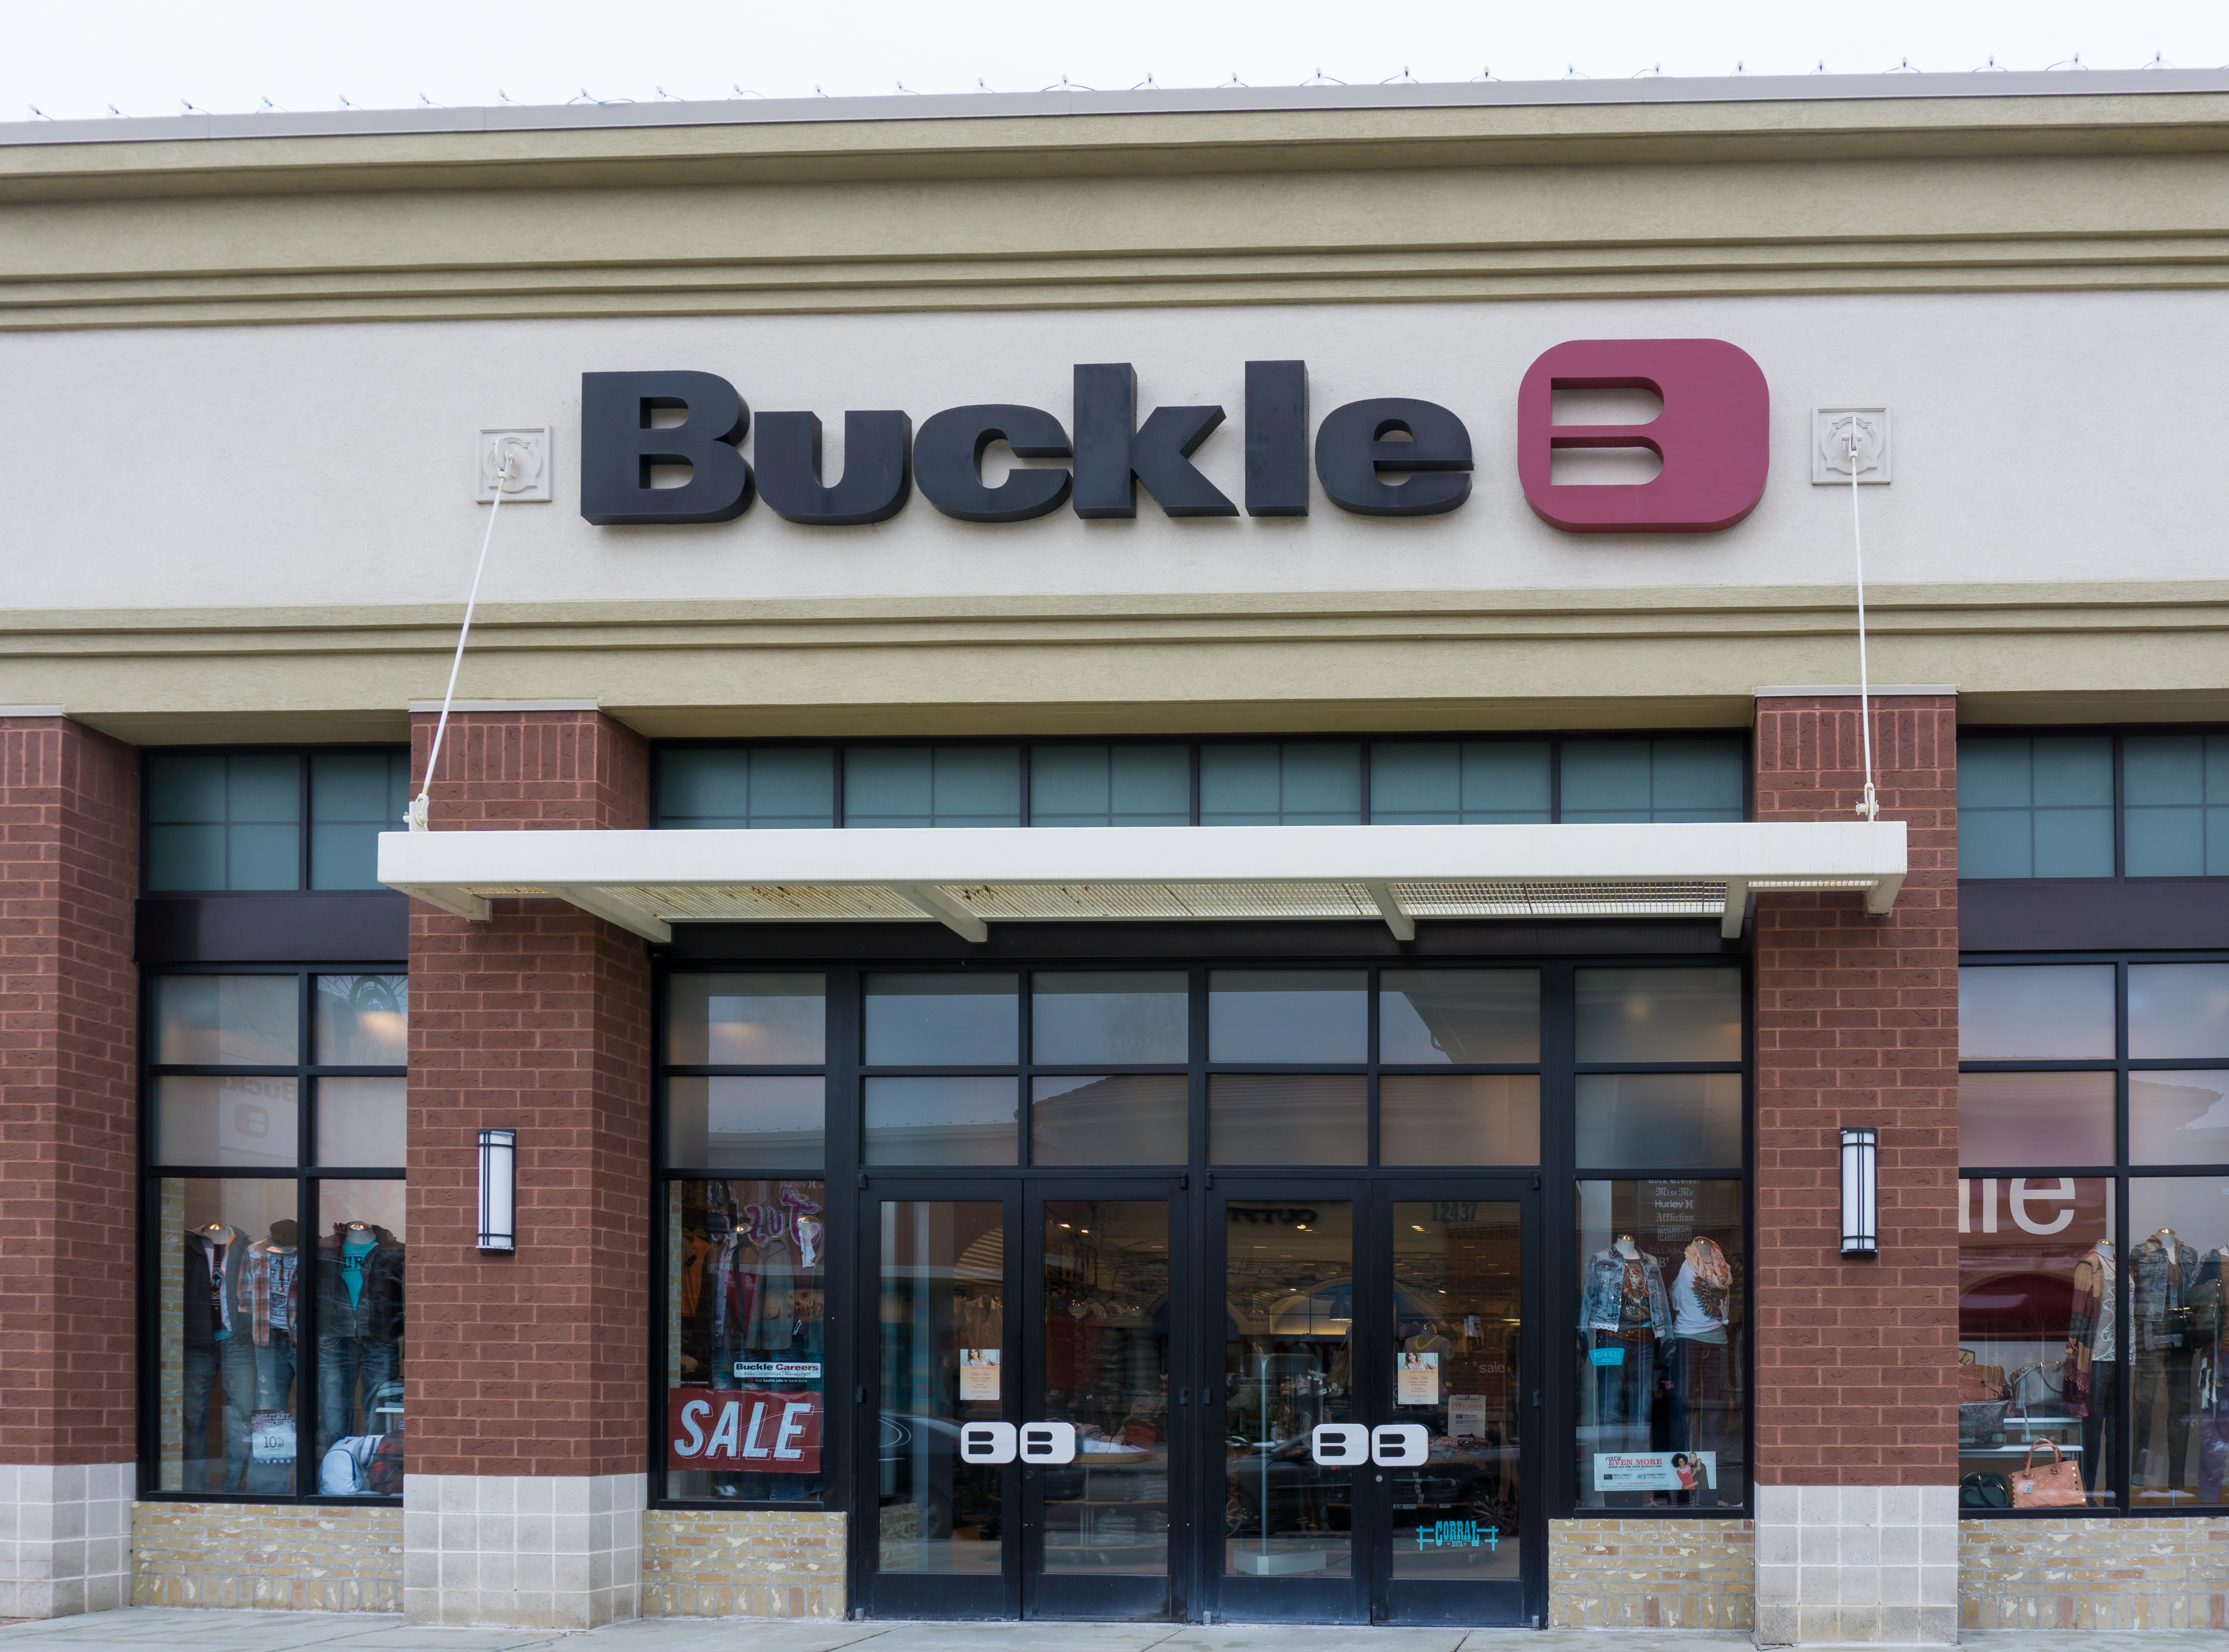
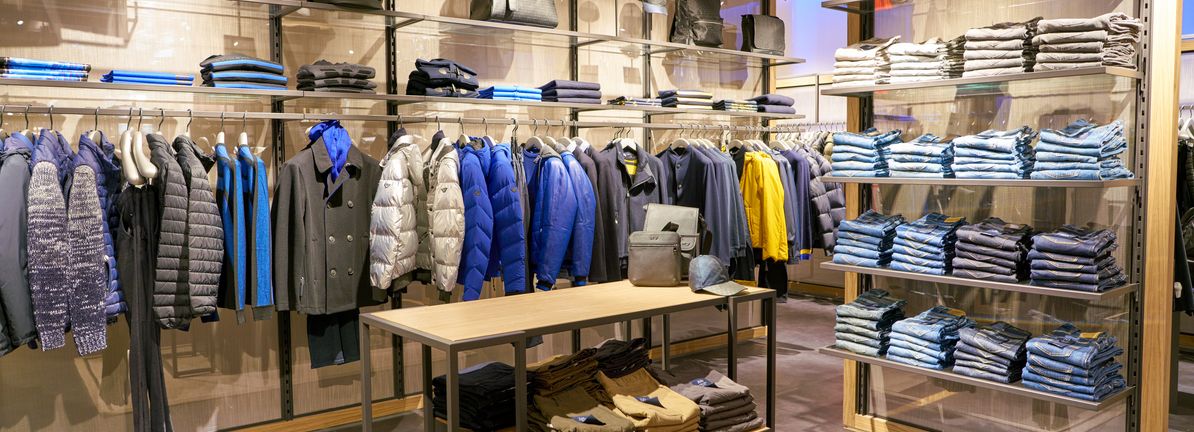
The Buckle, Inc. is a retailer of casual apparel, footwear, and accessories. The Company operates approximately 441 retail stores in 42 states. The Company markets a wide selection of casual apparel including denim, other casual bottoms, tops, sportswear, outerwear, accessories, and footwear. It also provides customer services, such as free hemming, free gift-packaging, easy layaways, the Buckle private label credit card, and a guest loyalty program. The Company offers denims from brands such as Flying Monkey, Hidden, KanCan, Levi’s, Miss Me, Rock Revival, Wrangler, and 7 For All Mankind. Its other key brands include Affliction, American Fighter, Ariat, Billabong, Birkenstock, Free People, Goorin Bros., Hey Dude, Hooey, Howitzer, Hurley, K. Swiss, Kimes Ranch, Lost Calf, Mia, Oakley, Old Row, Pendleton, Ray-Ban, Reebok, Ridge, RVCA, SOREL, Steve Madden, Sullen, Very G, White Crow, and Z Supply.
Wall Street analysts forecast BKE stock price to rise over the next 12 months. According to Wall Street analysts, the average 1-year price target for BKE is55.00 USD with a low forecast of 55.00 USD and a high forecast of 55.00 USD. However, analyst price targets are subjective and often lag stock prices, so investors should focus on the objective reasons behind analyst rating changes, which better reflect the company's fundamentals.
Buckle Inc revenue for the last quarter amounts to 288.74M USD, increased 6.11
Buckle Inc. EPS for the last quarter amounts to 0.92 USD, increased 31.43
Buckle Inc (BKE) has 2900 emplpoyees as of July 07 2026.
Today BKE has the market capitalization of 2.16B USD.