TechnipFMC Reports Strong Q4 Earnings, Analysts Adjust Price Targets
Written by Emily J. Thompson, Senior Investment Analyst
Updated: Feb 20 2026
0mins
Should l Buy FTI?
Source: Benzinga
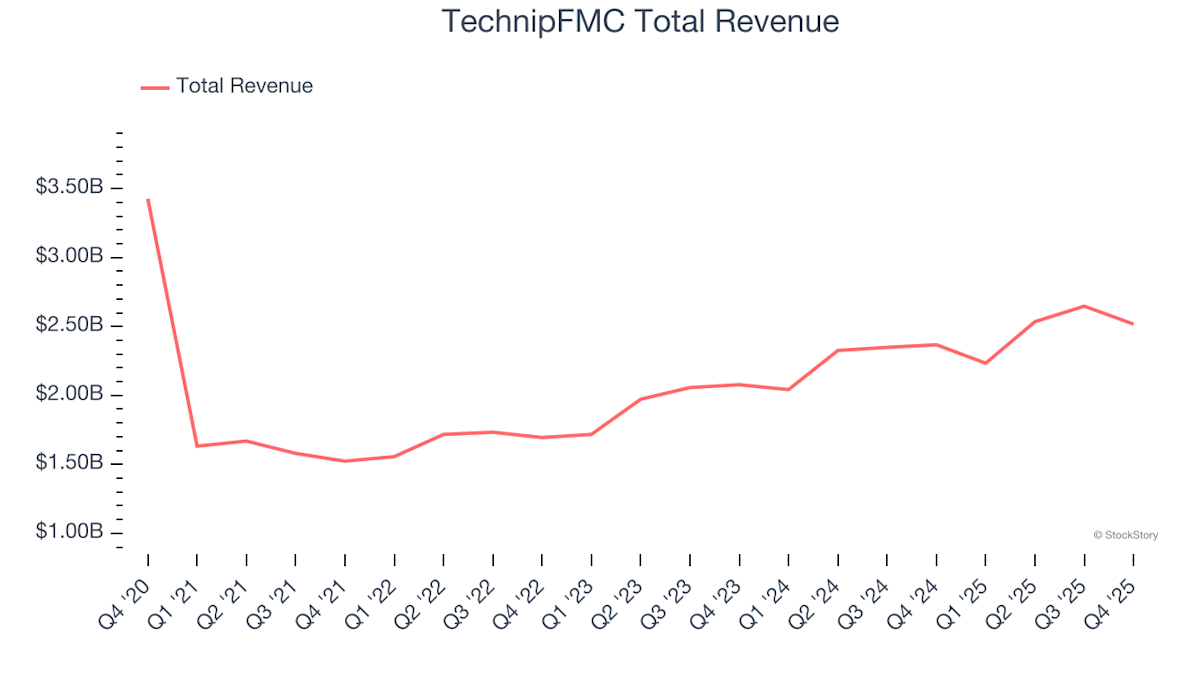
- Earnings Beat Expectations: TechnipFMC reported Q4 earnings of $0.70 per share, surpassing the analyst consensus of $0.51, indicating strong profitability despite sales falling short of expectations.
- Sales Missed Targets: The company recorded quarterly sales of $2.048 billion, which was below the analyst consensus estimate of $2.530 billion, reflecting potential fluctuations in market demand impacting revenue growth.
- Optimistic Future Outlook: TechnipFMC forecasts FY2026 sales between $10.350 billion and $10.900 billion, although this is below market estimates of $10.701 billion, it still demonstrates the company's confidence in future growth.
- Analyst Rating Adjustments: Following the earnings announcement, several analysts adjusted their ratings on TechnipFMC, with HSBC downgrading from Buy to Hold while raising the price target to $62, indicating a cautious market outlook on the company's prospects.
Trade with 70% Backtested Accuracy
Stop guessing "Should I Buy FTI?" and start using high-conviction signals backed by rigorous historical data.
Sign up today to access powerful investing tools and make smarter, data-driven decisions.
Analyst Views on FTI
Wall Street analysts forecast FTI stock price to fall
11 Analyst Rating
10 Buy
1 Hold
0 Sell
Strong Buy
Current: 72.800
Low
40.00
Averages
48.50
High
53.00
Current: 72.800
Low
40.00
Averages
48.50
High
53.00
About FTI
TechnipFMC plc is a United Kingdom-based technology company, which operates in the energy industry. The Company is focused on delivering fully integrated projects, products, and services. The Company operates through two segments: Subsea and Surface Technologies. The Subsea segment manufactures and designs products and systems, performs engineering, procurement and project management and provides services used by oil and gas companies involved in offshore exploration and production of crude oil and natural gas. The Surface Technologies segment designs, manufactures and supplies technologically advanced wellhead systems and high-pressure valves and pumps used in stimulation activities for oilfield service companies and provides installation, flowback and other services for exploration and production companies. The Company operates across various countries, including the United States; Brazil; Norway; the United Kingdom; Guyana, Australia, Angola, Brazil and all other countries.
About the author

Emily J. Thompson
Emily J. Thompson, a Chartered Financial Analyst (CFA) with 12 years in investment research, graduated with honors from the Wharton School. Specializing in industrial and technology stocks, she provides in-depth analysis for Intellectia’s earnings and market brief reports.
Q4 Earnings Review of Oilfield Services Stocks
- Industry Overview: The 26 oilfield services stocks reported a collective revenue that exceeded analysts' expectations by 3.7% in Q4, indicating signs of recovery in the sector despite facing price volatility and competitive pressures.
- TechnipFMC Performance: TechnipFMC reported revenues of $2.52 billion, a 6.3% year-over-year increase, falling short of analyst expectations but beating EPS estimates, showcasing strong operational momentum that drove its stock price up by 16%.
- Liberty Energy's Strong Quarter: Liberty Energy achieved revenues of $1.04 billion, up 10.1% year-on-year, surpassing analyst expectations by 16.3%, marking it as the best performer among peers, with a stock price increase of 27.3%, reflecting market confidence in its growth potential.
- World Kinect's Disappointment: World Kinect reported revenues of $9.03 billion, down 7.5% year-on-year, missing analyst expectations, which led to a 10.3% decline in its stock price, highlighting the negative impact of weak demand in a competitive market.
See More

Four High-Efficiency Stocks Outperforming Peers
- Repsol Profitability Potential: Repsol boasts an average four-quarter earnings surprise of 18.7%, indicating strong profitability in the oil and gas sector, which is expected to drive stock price appreciation and attract investor interest.
- TechnipFMC Leadership Position: TechnipFMC has an average four-quarter earnings surprise of 15.9%, and as a leading manufacturer in the energy sector, the growing demand for its technological solutions may further enhance its market share.
- Telefonica Brasil Growth Outlook: Telefonica Brasil's average four-quarter earnings surprise stands at 7.7%, providing diverse communication and entertainment solutions in Brazil's telecom market, which is likely to benefit from long-term growth driven by digital transformation.
- USA Compression Service Advantage: USA Compression Partners has an average four-quarter earnings surprise of 1.2%, and as one of the largest independent natural gas compression service providers in the U.S., its stable service demand will help maintain profitability and strengthen market competitiveness.
See More

Analysis of OIH ETF's 52-Week Price Fluctuations
- Price Range Analysis: The OIH ETF's 52-week low is $191.21 per share, with a high of $423.85, and a recent trade at $404.79, indicating strong performance near its peak, which may attract more investor interest.
- Technical Analysis Tool: Comparing the current share price to the 200-day moving average provides valuable insights for investors, aiding in market trend assessment and potential buying opportunities.
- ETF Trading Mechanism: ETFs trade similarly to stocks, where investors buy and sell 'units' that can be created or destroyed based on demand, impacting the ETF's liquidity and market performance.
- Inflows and Outflows Monitoring: Weekly monitoring of changes in shares outstanding helps identify ETFs experiencing significant inflows or outflows, which can influence the price movements of the underlying components within the ETF.
See More

Analysis of MDY ETF's 52-Week Price Fluctuations
- Price Range Analysis: The MDY ETF's 52-week low is $458.82 per share, with a high of $662.65, and the latest trade at $609.34 indicates stability within this range, aiding investors in assessing market performance.
- Technical Analysis Tool: Comparing the latest share price to the 200-day moving average provides investors with deeper insights for technical analysis, enhancing the effectiveness of their trading decisions.
- ETF Trading Mechanism: Exchange-traded funds (ETFs) trade like stocks, where investors buy and sell 'units' that can be created or destroyed based on demand, reflecting market liquidity and demand fluctuations.
- Inflows and Outflows Monitoring: Weekly monitoring of changes in shares outstanding helps identify ETFs experiencing significant inflows (new units created) or outflows (old units destroyed), allowing for timely adjustments in investment strategies and optimizing asset allocation.
See More

Investment Outlook for Oilfield Services Sector
- TechnipFMC Growth Potential: TechnipFMC benefits directly from a subsea upcycle exceeding $30 billion, with strong order inflows and a pipeline of approximately $29 billion providing long-term revenue visibility, indicating high-margin growth potential tied to the ongoing offshore investment cycle.
- SLB Diversification: SLB operates across the entire upstream value chain, generating over $4 billion in free cash flow for 2025 to support aggressive shareholder returns, and despite facing pricing pressure and margin compression in international markets, its global presence ensures resilience across energy cycles.
- Financial Performance Comparison: FTI's forward P/E ratio stands at 23.3X, while SLB's is at 17.05X, suggesting SLB is relatively cheaper; however, its EPS estimates for 2026 and 2027 indicate some volatility, reflecting the challenges in its core segments.
- Market Trends and Challenges: While TechnipFMC showcases strong fundamentals with clear earnings growth and expanding margins, SLB also presents growth potential in high-margin digital and energy-tech solutions, yet its core business faces near-term challenges that could impact profitability.
See More

Nvidia Earnings Outlook Upgraded, Market Prospects Optimistic
- Earnings Outlook Upgraded: Analysts have nearly unanimously raised Nvidia's earnings outlook over the past 60 days, reflecting strong market confidence in its future growth, particularly with AI chip sales projected to reach $1 trillion by 2027, showcasing the company's robust competitive edge in the AI sector.
- Attractive Valuation: Nvidia's current P/E ratio stands at 23.7x, near its lowest level in a decade and significantly below the 10-year average of 45.3x, indicating that investors are purchasing the company at market-like multiples while its earnings growth is over three times that of the broader index, highlighting the stock's appeal.
- Strong Market Demand: With leading cloud providers like Alphabet, Microsoft, and Amazon accelerating growth, the demand for Nvidia's AI infrastructure continues to exceed supply, particularly as its data center capabilities are being oversubscribed, further solidifying its market position.
- Investor Confidence Boosted: Despite the stock's stagnation over recent months, Nvidia's strong fundamentals and upward earnings revisions, combined with robust market demand, create a favorable risk-reward setup for medium- to long-term investors.
See More
Q4 Earnings Review of Oilfield Services Stocks
- Industry Overview: The 26 oilfield services stocks reported a collective revenue that exceeded analysts' expectations by 3.7% in Q4, indicating signs of recovery in the sector despite facing price volatility and competitive pressures.
- TechnipFMC Performance: TechnipFMC reported revenues of $2.52 billion, a 6.3% year-over-year increase, falling short of analyst expectations but beating EPS estimates, showcasing strong operational momentum that drove its stock price up by 16%.
- Liberty Energy's Strong Quarter: Liberty Energy achieved revenues of $1.04 billion, up 10.1% year-on-year, surpassing analyst expectations by 16.3%, marking it as the best performer among peers, with a stock price increase of 27.3%, reflecting market confidence in its growth potential.
- World Kinect's Disappointment: World Kinect reported revenues of $9.03 billion, down 7.5% year-on-year, missing analyst expectations, which led to a 10.3% decline in its stock price, highlighting the negative impact of weak demand in a competitive market.
See More
Four High-Efficiency Stocks Outperforming Peers
- Repsol Profitability Potential: Repsol boasts an average four-quarter earnings surprise of 18.7%, indicating strong profitability in the oil and gas sector, which is expected to drive stock price appreciation and attract investor interest.
- TechnipFMC Leadership Position: TechnipFMC has an average four-quarter earnings surprise of 15.9%, and as a leading manufacturer in the energy sector, the growing demand for its technological solutions may further enhance its market share.
- Telefonica Brasil Growth Outlook: Telefonica Brasil's average four-quarter earnings surprise stands at 7.7%, providing diverse communication and entertainment solutions in Brazil's telecom market, which is likely to benefit from long-term growth driven by digital transformation.
- USA Compression Service Advantage: USA Compression Partners has an average four-quarter earnings surprise of 1.2%, and as one of the largest independent natural gas compression service providers in the U.S., its stable service demand will help maintain profitability and strengthen market competitiveness.
See More
Analysis of OIH ETF's 52-Week Price Fluctuations
- Price Range Analysis: The OIH ETF's 52-week low is $191.21 per share, with a high of $423.85, and a recent trade at $404.79, indicating strong performance near its peak, which may attract more investor interest.
- Technical Analysis Tool: Comparing the current share price to the 200-day moving average provides valuable insights for investors, aiding in market trend assessment and potential buying opportunities.
- ETF Trading Mechanism: ETFs trade similarly to stocks, where investors buy and sell 'units' that can be created or destroyed based on demand, impacting the ETF's liquidity and market performance.
- Inflows and Outflows Monitoring: Weekly monitoring of changes in shares outstanding helps identify ETFs experiencing significant inflows or outflows, which can influence the price movements of the underlying components within the ETF.
See More
Analysis of MDY ETF's 52-Week Price Fluctuations
- Price Range Analysis: The MDY ETF's 52-week low is $458.82 per share, with a high of $662.65, and the latest trade at $609.34 indicates stability within this range, aiding investors in assessing market performance.
- Technical Analysis Tool: Comparing the latest share price to the 200-day moving average provides investors with deeper insights for technical analysis, enhancing the effectiveness of their trading decisions.
- ETF Trading Mechanism: Exchange-traded funds (ETFs) trade like stocks, where investors buy and sell 'units' that can be created or destroyed based on demand, reflecting market liquidity and demand fluctuations.
- Inflows and Outflows Monitoring: Weekly monitoring of changes in shares outstanding helps identify ETFs experiencing significant inflows (new units created) or outflows (old units destroyed), allowing for timely adjustments in investment strategies and optimizing asset allocation.
See More
Investment Outlook for Oilfield Services Sector
- TechnipFMC Growth Potential: TechnipFMC benefits directly from a subsea upcycle exceeding $30 billion, with strong order inflows and a pipeline of approximately $29 billion providing long-term revenue visibility, indicating high-margin growth potential tied to the ongoing offshore investment cycle.
- SLB Diversification: SLB operates across the entire upstream value chain, generating over $4 billion in free cash flow for 2025 to support aggressive shareholder returns, and despite facing pricing pressure and margin compression in international markets, its global presence ensures resilience across energy cycles.
- Financial Performance Comparison: FTI's forward P/E ratio stands at 23.3X, while SLB's is at 17.05X, suggesting SLB is relatively cheaper; however, its EPS estimates for 2026 and 2027 indicate some volatility, reflecting the challenges in its core segments.
- Market Trends and Challenges: While TechnipFMC showcases strong fundamentals with clear earnings growth and expanding margins, SLB also presents growth potential in high-margin digital and energy-tech solutions, yet its core business faces near-term challenges that could impact profitability.
See More
Nvidia Earnings Outlook Upgraded, Market Prospects Optimistic
- Earnings Outlook Upgraded: Analysts have nearly unanimously raised Nvidia's earnings outlook over the past 60 days, reflecting strong market confidence in its future growth, particularly with AI chip sales projected to reach $1 trillion by 2027, showcasing the company's robust competitive edge in the AI sector.
- Attractive Valuation: Nvidia's current P/E ratio stands at 23.7x, near its lowest level in a decade and significantly below the 10-year average of 45.3x, indicating that investors are purchasing the company at market-like multiples while its earnings growth is over three times that of the broader index, highlighting the stock's appeal.
- Strong Market Demand: With leading cloud providers like Alphabet, Microsoft, and Amazon accelerating growth, the demand for Nvidia's AI infrastructure continues to exceed supply, particularly as its data center capabilities are being oversubscribed, further solidifying its market position.
- Investor Confidence Boosted: Despite the stock's stagnation over recent months, Nvidia's strong fundamentals and upward earnings revisions, combined with robust market demand, create a favorable risk-reward setup for medium- to long-term investors.
See More