CGGO: Large Inflows Detected at ETF
- Stock Price Analysis: The article discusses CGGO's stock price range, with a low of $22.075 and a high of $29.53 per share, compared to the last trade at $29.44. It also mentions comparing the share price to the 200-day moving average for technical analysis.
- Exchange Traded Funds (ETFs): ETFs trade like stocks but involve buying and selling units instead of shares. These units can be created or destroyed based on investor demand, impacting the underlying holdings of the ETFs.
- Monitoring Inflows and Outflows: Weekly monitoring of changes in shares outstanding data helps identify ETFs experiencing notable inflows (new units created) or outflows (old units destroyed). Large flows can affect the individual components held within ETFs.
- Notable Inflows: The article mentions that readers can find out about 9 other ETFs with notable inflows by clicking on a provided link.
- Disclaimer: The views and opinions expressed in the article are those of the author and may not necessarily reflect those of Nasdaq, Inc.
Trade with 70% Backtested Accuracy
Analyst Views on CGGO
About the author


Significant Withdrawals Observed in CGGO, FI, AON, BN ETFs
CGGO Stock Performance
- 52-Week Range: CGGO's stock has a low point of $24.67 and a high point of $33.0472 over the past year, with the most recent trade recorded at $32.66.
- Technical Analysis: The comparison of the current share price to the 200-day moving average is highlighted as a useful technique for investors.
Exchange-Traded Funds (ETFs)
- Trading Mechanism: ETFs function similarly to stocks, where investors buy and sell "units" instead of shares. These units can be created or destroyed based on investor demand.
- Monitoring Changes: Weekly monitoring of the change in shares outstanding helps identify ETFs with significant inflows (new units created) or outflows (old units destroyed), which can affect the underlying assets of the ETFs.
Additional Information
- Author's Views: The opinions expressed in the article are solely those of the author and do not necessarily represent the views of Nasdaq, Inc.

CGGO, FIX, C, BKNG: ETF Inflow Alert
Stock Performance Overview: CGGO's share price is currently at $32.62, close to its 52-week high of $32.7297, with a low of $24.67 during the same period.
ETFs Trading Dynamics: ETFs function like stocks but involve trading "units" that can be created or destroyed based on investor demand, affecting the underlying holdings and market flows.

Capital Group Global Growth Equity Breaks Above 200-Day Moving Average - Bullish for CGGO
52 Week Range of CGGO: CGGO's stock has a 52-week low of $24.67 and a high of $30.939, with the last trade recorded at $29.40.
Author's Opinion Disclaimer: The views expressed in the article are solely those of the author and do not necessarily represent Nasdaq, Inc.
CGGO Crosses Critical Technical Indicator
Current RSI and Market Performance: Capital Group Global Growth Equity (CGGO) has an RSI reading of 29.9, indicating potential exhaustion from heavy selling, compared to the S&P 500's 30.7. CGGO shares are trading at $27.55, down 3.6% for the day.
Investment Opportunity: Bullish investors may see the low RSI as a signal to look for buying opportunities, given CGGO's 52-week range of $26.52 to $30.939.
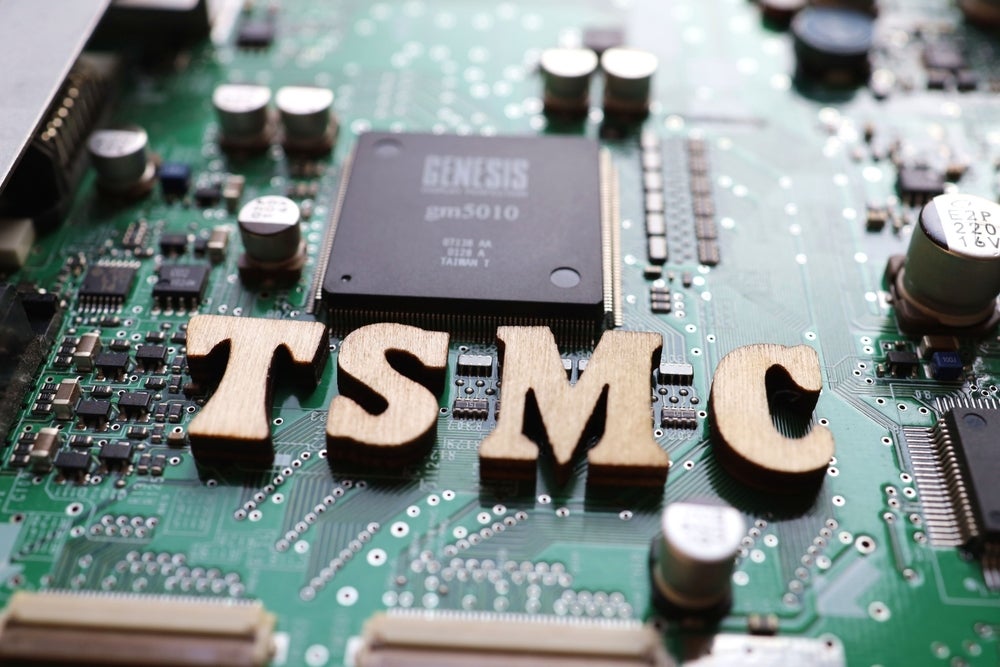
Taiwan Semiconductor Gains Government Support, Faces Trump's Tariff Threats, Cheaper Chinese Rivals
Taiwan's Government Support: Taiwan Semiconductor Manufacturing Co (TSMC) is expected to receive potential support from the Taiwanese government in response to U.S. tariff threats, with discussions on cooperative plans and assistance programs underway.
Economic Impact and Investments: TSMC has made significant investments in the U.S., totaling $65 billion, and reported a substantial increase in trade surplus with the U.S., while also planning a capex increase for fiscal 2025.

CGGO: Large Inflows Detected at ETF
Significant Withdrawals Observed in CGGO, FI, AON, BN ETFs
CGGO Stock Performance
- 52-Week Range: CGGO's stock has a low point of $24.67 and a high point of $33.0472 over the past year, with the most recent trade recorded at $32.66.
- Technical Analysis: The comparison of the current share price to the 200-day moving average is highlighted as a useful technique for investors.
Exchange-Traded Funds (ETFs)
- Trading Mechanism: ETFs function similarly to stocks, where investors buy and sell "units" instead of shares. These units can be created or destroyed based on investor demand.
- Monitoring Changes: Weekly monitoring of the change in shares outstanding helps identify ETFs with significant inflows (new units created) or outflows (old units destroyed), which can affect the underlying assets of the ETFs.
Additional Information
- Author's Views: The opinions expressed in the article are solely those of the author and do not necessarily represent the views of Nasdaq, Inc.
CGGO, FIX, C, BKNG: ETF Inflow Alert
Stock Performance Overview: CGGO's share price is currently at $32.62, close to its 52-week high of $32.7297, with a low of $24.67 during the same period.
ETFs Trading Dynamics: ETFs function like stocks but involve trading "units" that can be created or destroyed based on investor demand, affecting the underlying holdings and market flows.
Capital Group Global Growth Equity Breaks Above 200-Day Moving Average - Bullish for CGGO
52 Week Range of CGGO: CGGO's stock has a 52-week low of $24.67 and a high of $30.939, with the last trade recorded at $29.40.
Author's Opinion Disclaimer: The views expressed in the article are solely those of the author and do not necessarily represent Nasdaq, Inc.
CGGO Crosses Critical Technical Indicator
Current RSI and Market Performance: Capital Group Global Growth Equity (CGGO) has an RSI reading of 29.9, indicating potential exhaustion from heavy selling, compared to the S&P 500's 30.7. CGGO shares are trading at $27.55, down 3.6% for the day.
Investment Opportunity: Bullish investors may see the low RSI as a signal to look for buying opportunities, given CGGO's 52-week range of $26.52 to $30.939.
Taiwan Semiconductor Gains Government Support, Faces Trump's Tariff Threats, Cheaper Chinese Rivals
Taiwan's Government Support: Taiwan Semiconductor Manufacturing Co (TSMC) is expected to receive potential support from the Taiwanese government in response to U.S. tariff threats, with discussions on cooperative plans and assistance programs underway.
Economic Impact and Investments: TSMC has made significant investments in the U.S., totaling $65 billion, and reported a substantial increase in trade surplus with the U.S., while also planning a capex increase for fiscal 2025.