Avalanche Market Dynamics: Tug of War Between On-Chain Growth and Institutional Hesitation

- Price Movement Analysis: Avalanche (AVAX) is currently trading at approximately $9.35, having appreciated by 3.88% over the past 24 hours, although it remains significantly below historical highs, indicating cautious market sentiment regarding its price trajectory.
- Resistance Level Challenge: AVAX is hovering around the resistance range of $9.20 to $9.50, and if it successfully breaks through, it could initiate an upward trend with target prices expected between $11 and $13; conversely, slipping below $8 may lead to increased downward pressure.
- Surge in On-Chain Activity: The Avalanche network has reached over 20.5 million transactions, marking the highest volume in over two years, indicating increased user engagement and the introduction of new decentralized applications, which are favorable for AVAX's medium to long-term performance.
- Institutional Participation Lags: Despite strong on-chain growth, AVAX-associated ETFs have seen a significant decline in inflows since mid-March, reflecting waning interest from institutional investors, and analysts believe that a resurgence in ETF inflows is crucial for rekindling enthusiasm among larger investors.
Get Real-Time Alerts for Any Crypto Movement
Technical Analysis for AVAX
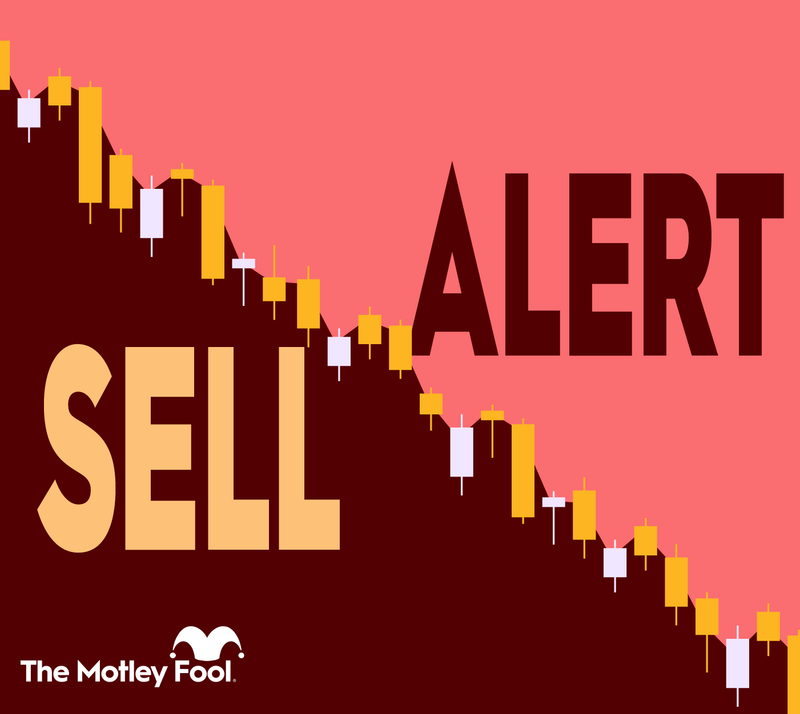
Technical Sentiment Analysis for Avalanche (AVAX). As of , Avalanche (AVAX) is exhibiting a Strong sell technical sentiment. Our proprietary analysis, which aggregates 7 technical signals, shows that 1 indicators are flashing buy, while 6 are indicating sell.
Momentum Indicators: RSI, MACD & Overbought/Oversold Status. Currently, the Relative Strength Index (RSI) for AVAX stands at -, which suggests a Neutral condition. Meanwhile, the MACD (12, 26) indicator is at -, providing a Neutral signal for short-term momentum. Other oscillators like the Stochastic Oscillator at - and the Commodity Channel Index (CCI) at - further confirm a - outlook for the crypto.
Support, Resistance & Moving Averages. From a structural perspective, AVAX is trading below its 60-day moving average of $- and below its 200-day long-term moving average of $-. Key price levels to watch include the immediate resistance at $- and strong support at $-. A break above $- could signal a bull continuation, while falling below $- may test the next Fibonacci floor at $-.
Avalanche (AVAX) Support & Resistance Level
| Name | S3 | S2 | S1 | Pivot Points | R1 | R2 | R3 |
|---|---|---|---|---|---|---|---|
| Classic | 7.269 | 7.864 | 8.509 | 9.104 | 9.749 | 10.344 | 10.989 |
| Fibonacci | 7.864 | 8.338 | 8.631 | 9.104 | 9.578 | 9.871 | 10.344 |
About AVAX
About the author