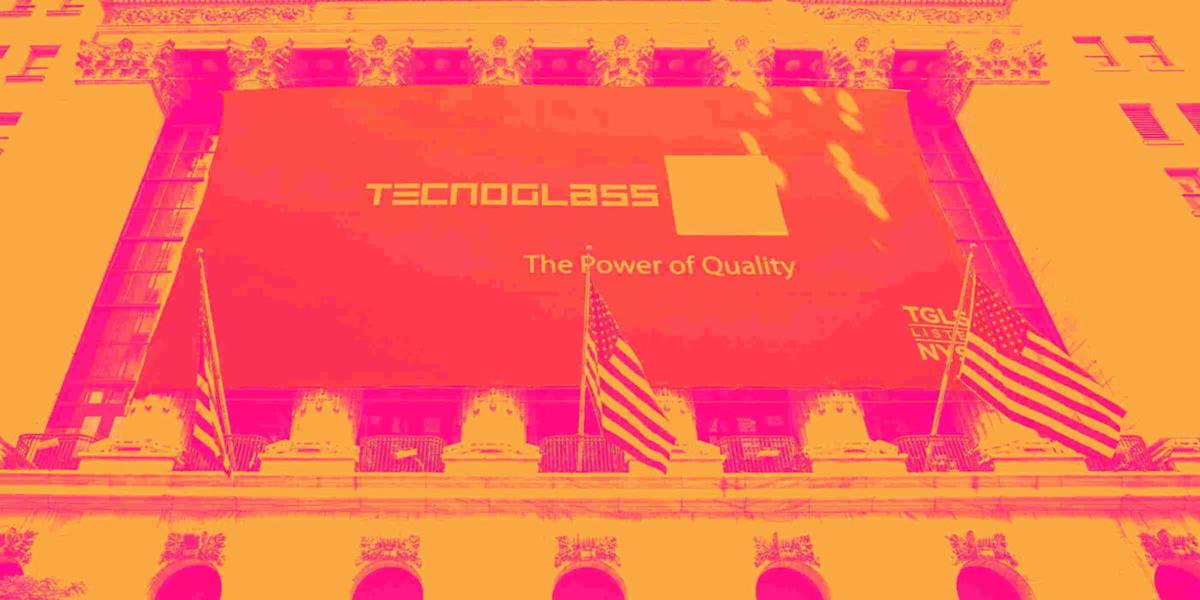
Loading...

Intellectia LogoIntellectia
AI Trading Bot
Features
Markets
News
Resources
Pricing
Get Started
  1. Home
  2. Stock
  3. TGLS
TGLS logo

TGLS Overview

-
$
0.000
0.000(0.000%)
At close
0.000(0.000%)Aft-market
ET
$
0.000
0.000(0.000%)
At close
0.000(0.000%)Aft-market
ET
OverviewStock Price PredictionTechnicalValuationFinancialsEarningsShould I BuyNews & Events
an image of Intellectia Logoan image of Intellectia

Most Trusted AI Platform for Winning Trades

TwitterYoutubeQuoraDiscordLinkedinTelegram

Copyright © 2026 Intellectia.AI. All Rights Reserved.

Company

  • Home
  • Contact
  • About Us
  • Press
  • Privacy
  • Terms of Service
  • Service Terms of Use

Resources

  • Blog
  • Tutorial
  • Help Center
  • Affiliate Program

Markets

  • Market Analysis
  • Crypto
  • Featured Screeners
  • AI Earnings Calendar
  • Market Movers
  • Stock Monitor
  • Economic Calendar
  • All US Stocks
  • All Cryptos

Tools

  • Dividend Calculator
  • Dividend Yield Calculator
  • Options Profit Calculator

Features

  • QuantAI Alpha Pick
  • SwingMax Portfolio
  • Swing Trading
  • AI Stock Picker
  • Whales Auto Tracker
  • Daytrading Center
  • Patterns Detection
  • AI Screener
  • Financial AI Agent
  • Backtesting Playground
  • AI Earnings Prediction
  • Stock Monitor
  • Technical Analysis

News

  • Overview
  • Top News
  • Daily Market Brief
  • Earnings Analysis
  • Newswire
  • Stock News
  • Crypto News
  • Institution News
  • Congress News
  • Monitor News

Compare

  • TradingView
  • SeekingAlpha
Intellectia

Loading chart...

High
42.580
Open
42.210
VWAP
40.58
Vol
461.28K
Mkt Cap
1.77B
Low
39.370
Amount
18.72M
EV/EBITDA(TTM)
7.30
Total Shares
44.36M
EV
1.87B
EV/OCF(TTM)
17.91
P/S(TTM)
1.82
Tecnoglass Inc. (Tecnoglass) is a holding company. The Company is a manufacturer of architectural glass and windows for the western hemisphere residential and commercial construction industries. It manufactures a range of glass products installed primarily in commercial and residential buildings, including tempered safety, double thermo-acoustic and laminated glass. Its products are installed in hotels, residential buildings, commercial and corporate centers, universities, airports and hospitals in a range of applications, such as floating facades, windows, doors, handrails, interior and bathroom spatial dividers. Tecnoglass also produces aluminum products, such as profiles, rods, bars, plates and other hardware used in the manufacture of windows. It designs, manufactures, markets and installs architectural systems for high, medium and low rise construction, glass and aluminum windows and doors, office dividers and interiors, floating facades and commercial display windows.
Show More

Events Timeline

(ET)
2026-05-07
07:50:00
Tecnoglass Q1 Revenue $248.39M Beats Expectations
select
2026-05-07
07:50:00
Tecnoglass Maintains FY26 Adjusted EBITDA Outlook of $225M to $245M
select
2026-04-10 (ET)
2026-04-10
16:10:00
S&P 500 Closes Slightly Lower on Friday Amid Oil Volatility
select
2026-04-10
12:00:00
Dow Jones Falls, Nasdaq Rises as Markets Mixed
select
2026-04-10
09:00:00
Stock Futures Flat as Market Awaits Confirmation
select
2026-04-09 (ET)
2026-04-09
16:40:00
Tecnoglass Updates 2026 EBITDA Guidance to $225M-$245M
select

News

seekingalpha
9.5
05-06seekingalpha
Tecnoglass Q1 Earnings Announcement Scheduled
  • Earnings Release Date: Tecnoglass is set to announce its Q1 earnings on May 7 before market open, with market participants keenly awaiting the results, which could impact short-term stock performance.
  • Earnings Expectations: The consensus EPS estimate stands at $0.72, reflecting a year-over-year decline of 21.7%, indicating potential profitability challenges that may affect investor sentiment.
  • Revenue Expectations: The consensus revenue estimate is $242.45 million, representing a year-over-year increase of 9.1%, suggesting that despite the earnings decline, Tecnoglass shows resilience in revenue growth, which may attract long-term investors.
  • Performance Beat Record: Over the past two years, Tecnoglass has beaten EPS estimates 63% of the time and revenue estimates 75% of the time, indicating a relative stability in performance during earnings releases, potentially providing confidence to investors.
Yahoo Finance
2.0
04-27Yahoo Finance
Tecnoglass Stock Drops 24.7% Amid Profitability Concerns
  • Declining Profitability: Tecnoglass's earnings per share (EPS) has decreased by 5.2% annually over the past two years, despite an 8.6% revenue growth, indicating a weakening in profitability per share during expansion, which may undermine investor confidence.
  • Dropping Free Cash Flow Margin: The company's free cash flow margin has fallen by 9.7 percentage points over the last five years to 3.5%, suggesting increasing investment needs and capital intensity, which could pose risks to operational sustainability.
  • Decreasing Return on Invested Capital: Tecnoglass's return on invested capital (ROIC) has been on a downward trend, indicating a reduction in operating profit relative to the capital raised, which may reflect fewer profitable growth opportunities and impact future stock performance.
  • Cautious Market Outlook: Although Tecnoglass trades at a forward P/E of 15.9, analysts suggest that the potential downside risks outweigh the fair valuation, recommending investors to consider more attractive investment alternatives currently available in the market.
Yahoo Finance
4.5
04-11Yahoo Finance
Market Remains Cautious as Oil Approaches $100 Amid Inflation Concerns
  • Market Dynamics: Stock futures are essentially flat, reflecting a cautious market waiting for confirmation, with momentum from earlier in the week fading as investors remain on the sidelines regarding future trends.
  • Oil Price Movement: Oil prices are creeping higher again, hovering near the $100 per barrel level, primarily due to doubts about the durability of the ceasefire and ongoing disruptions in the Strait of Hormuz, indicating persistent inflationary pressures.
  • CPI Report Impact: The Consumer Price Index (CPI) report showed the sharpest year-over-year price increases for consumers in nearly four years, largely driven by the recent energy shock, and despite a pause in fighting, oil flows remain constrained and supply chains are still disrupted.
  • Stock Market Performance: In pre-market trading, S&P 500 futures rose 0.14%, Nasdaq futures rose 0.21%, and Dow futures rose 0.02%, reflecting a cautiously optimistic sentiment in the market regarding future developments.
NASDAQ.COM
4.5
04-10NASDAQ.COM
Mixed Close for US Stocks as Nasdaq Hits Six-Week High
  • Market Volatility: On Friday, the S&P 500 closed down 0.11%, the Dow Jones Industrial Average fell 0.56%, while the Nasdaq 100 rose 0.14%, reflecting a tug-of-war between software stock weakness and inflation concerns.
  • Inflation Data Impact: The US March CPI rose 3.3% year-on-year, slightly below the expected 3.4%, marking the largest increase in two years but failing to boost market confidence, as the consumer sentiment index dropped to a record low of 47.6.
  • Geopolitical Factors: Optimism surrounding US-Iran diplomatic negotiations has increased market sentiment regarding Middle Eastern tensions, although President Trump's comments about military readiness have raised concerns, putting pressure on stocks.
  • Sector Performance Divergence: Software stocks faced declines due to AI disruption fears, with ServiceNow and Cadence Design Systems down over 7% and 5%, respectively, while chipmakers like Broadcom and AMD rose over 4% and 3% due to increased market demand.
NASDAQ.COM
4.5
04-10NASDAQ.COM
US Stocks Fluctuate Amid Inflation Concerns Impacting Markets
  • Market Performance: The S&P 500 Index rose by 0.15%, reaching a five-week high, while the Nasdaq 100 Index increased by 0.35%, marking a six-week high, indicating market resilience amid easing inflation concerns.
  • Consumer Sentiment Decline: The University of Michigan's consumer sentiment index fell to a record low of 47.6, significantly below the expected 51.5, reflecting pessimism about the economic outlook that could negatively impact future consumer spending.
  • Oil Price Volatility: Despite the Strait of Hormuz remaining closed, WTI crude oil prices are experiencing volatility due to ongoing concerns about the situation in Iran, with over 800 vessels trapped, affecting global energy supply.
  • Tech Stock Pressure: Software stocks are under pressure due to fears of AI disruption, with ServiceNow and Datadog both down over 7%, highlighting uncertainty in the tech sector's future, which may affect investor confidence.
NASDAQ.COM
4.5
04-10NASDAQ.COM
US Stocks Fluctuate Slightly as Inflation Concerns Ease
  • Market Performance: The S&P 500 Index rose by 0.07%, reaching a five-week high, while the Nasdaq 100 Index increased by 0.37%, marking a six-week high, reflecting market optimism due to easing inflation concerns.
  • Inflation Data Impact: The US March Consumer Price Index rose 3.3% year-over-year, the largest increase in two years but slightly below the expected 3.4%, leading to a reduced market expectation of a 2% chance for a Fed rate hike.
  • Oil Price Volatility: WTI crude oil prices are fluctuating due to the near closure of shipping through the Strait of Hormuz, with over 800 vessels trapped, raising concerns about global energy supply amid heightened focus on the Iranian situation.
  • Tech Stock Pressure: Software stocks are under pressure due to AI disruption fears, with ServiceNow and Datadog down over 6% and 5% respectively, indicating market uncertainty regarding the future of the tech sector.
Wall Street analysts forecast TGLS stock price to rise
3 Analyst Rating
Wall Street analysts forecast TGLS stock price to rise
3 Buy
0 Hold
0 Sell
Strong Buy
Current: 0.000
sliders
Low
70.00
Averages
74.00
High
80.00
Current: 0.000
sliders
Low
70.00
Averages
74.00
High
80.00
Baird
Outperform
to
Outperform
downgrade
$62 -> $55
AI Analysis
2026-04-21
Reason
Baird
Price Target
$62 -> $55
AI Analysis
2026-04-21
downgrade
Outperform
to
Outperform
Reason
Baird lowered the firm's price target on Tecnoglass to $55 from $62 and keeps an Outperform rating on the shares. The firm's Q1 channel checks indicate residential building product activity remains lackluster, with spending weakness continuing and project indicators mixed. The group's fundamentals remain challenging and risks have again emerged around volume and margin assumptions for 2026, the analyst tells investors in a research note.
B. Riley
Buy
downgrade
$70 -> $65
2026-03-06
Reason
B. Riley
Price Target
$70 -> $65
2026-03-06
downgrade
Buy
Reason
B. Riley lowered the firm's price target on Tecnoglass to $65 from $70 and keeps a Buy rating on the shares. The firm attributes the selloff in the shares to higher aluminum costs and the peso's appreciation. Both are now embedded in Tecnoglass' fiscal 2026 outlook, creating an attractive valuation at current share levels, the analyst tells investors in a research note.
Unlock Full Analyst Thesis, Get the complete breakdown of rating reason for TGLS
Unlock Now

Valuation Metrics

The current forward P/E ratio for Tecnoglass Inc (TGLS.N) is 15.15, compared to its 5-year average forward P/E of 12.53. For a more detailed relative valuation and DCF analysis to assess Tecnoglass Inc's fair value, Click here.

Forward PE

The forward P/E ratio is a valuation metric that divides a company's current stock price by its estimated future earnings per share over the next 12 months.
StronglyUndervaluedUndervaluedFairOvervaluedStronglyOvervalueddotted line Image
5Y Average PE
12.53
Current PE
15.15
Overvalued PE
16.66
Undervalued PE
8.41

Forward EV/EBITDA

The forward EV/EBITDA ratio is a valuation metric that divides a company's enterprise value (EV) by its estimated future earnings before interest, taxes, depreciation, and amortization (EBITDA) over the next 12 months.
StronglyUndervaluedUndervaluedFairOvervaluedStronglyOvervalueddotted line Image
5Y Average EV/EBITDA
7.82
Current EV/EBITDA
8.21
Overvalued EV/EBITDA
10.16
Undervalued EV/EBITDA
5.48

Forward PS

The forward P/S ratio is a valuation metric that divides a company's current stock price by its estimated future sales (or revenue) per share over the next 12 months.
StronglyUndervaluedUndervaluedFairOvervaluedStronglyOvervalueddotted line Image
5Y Average PS
2.39
Current PS
1.65
Overvalued PS
3.12
Undervalued PS
1.66

Financials

AI Analysis
Annual
Quarterly

Related Community Screener

que accion me recomiendas comprar con 50
Intellectia · 82 candidates
Market Cap: 500.00M - 20.00BPrice: $5.00 - $50.00Analyst Consensus: Strong Buy, Moderate BuyRevenue 5yr Cagr: >= 10Eps 5yr Cagr: >= 10
Ticker
Name
Market Cap$
top bottom
CEPU logo
CEPU
Central Puerto SA
2.36B
HG logo
HG
Hamilton Insurance Group Ltd
3.13B
BTSG logo
BTSG
Brightspring Health Services Inc
8.02B
TGLS logo
TGLS
Tecnoglass Inc
2.04B
ATAT logo
ATAT
Atour Lifestyle Holdings Ltd
5.43B
FSM logo
FSM
Fortuna Mining Corp
4.17B
What stock has the most upside this 2026?
Intellectia · 48 candidates
Market Cap: 1000.00M - 100.00BAnalyst Consensus: Strong Buy, Moderate BuyRevenue 5yr Cagr: >= 10Eps 5yr Cagr: >= 10List Exchange: XNYS, XNAS, XASETarget Price Upside Potential: MoreAbovePrice
Ticker
Name
Market Cap$
top bottom
KSPI logo
KSPI
Kaspi.kz AO
15.02B
QFIN logo
QFIN
Qfin Holdings Inc
2.14B
NICE logo
NICE
Nice Ltd
7.07B
PTC logo
PTC
PTC Inc
19.28B
JD logo
JD
JD.com Inc
42.34B
TW logo
TW
Tradeweb Markets Inc
24.31B
Likely to increase 50% in one year
Intellectia · 7 candidates
Beta: HighRiskRevenue 5yr Cagr: >= 15Eps 5yr Cagr: >= 15Pe Ttm: <= 25Target Price Upside Potential: MoreAbovePrice
Ticker
Name
Market Cap$
top bottom
FUTU logo
FUTU
Futu Holdings Ltd
23.11B
SMCI logo
SMCI
Super Micro Computer Inc
19.25B
CPRX logo
CPRX
Catalyst Pharmaceuticals Inc
2.97B
DAVE logo
DAVE
Dave Inc
2.51B
TGLS logo
TGLS
Tecnoglass Inc
2.44B
OPRA logo
OPRA
Opera Ltd
1.21B

Whales Holding TGLS

L
LarrainVial Asset Management Administradora General de Fondos SA
Holding
TGLS
-9.49%
3M Return

Trading Trends

    Insider
    Hedge Fund
    Congress Trading

People Also Watch

Frequently Asked Questions

What is Tecnoglass Inc (TGLS) stock price today?

The current price of TGLS is 39.79 USD — it has decreased -6.24

What is Tecnoglass Inc (TGLS)'s business?

Tecnoglass Inc. (Tecnoglass) is a holding company. The Company is a manufacturer of architectural glass and windows for the western hemisphere residential and commercial construction industries. It manufactures a range of glass products installed primarily in commercial and residential buildings, including tempered safety, double thermo-acoustic and laminated glass. Its products are installed in hotels, residential buildings, commercial and corporate centers, universities, airports and hospitals in a range of applications, such as floating facades, windows, doors, handrails, interior and bathroom spatial dividers. Tecnoglass also produces aluminum products, such as profiles, rods, bars, plates and other hardware used in the manufacture of windows. It designs, manufactures, markets and installs architectural systems for high, medium and low rise construction, glass and aluminum windows and doors, office dividers and interiors, floating facades and commercial display windows.

What is the price predicton of TGLS Stock?

Wall Street analysts forecast TGLS stock price to rise over the next 12 months. According to Wall Street analysts, the average 1-year price target for TGLS is74.00 USD with a low forecast of 70.00 USD and a high forecast of 80.00 USD. However, analyst price targets are subjective and often lag stock prices, so investors should focus on the objective reasons behind analyst rating changes, which better reflect the company's fundamentals.

What is Tecnoglass Inc (TGLS)'s revenue for the last quarter?

Tecnoglass Inc revenue for the last quarter amounts to 249.01M USD, increased 12.02

What is Tecnoglass Inc (TGLS)'s earnings per share (EPS) for the last quarter?

Tecnoglass Inc. EPS for the last quarter amounts to 0.71 USD, decreased -21.11

How many employees does Tecnoglass Inc (TGLS). have?

Tecnoglass Inc (TGLS) has 9601 emplpoyees as of May 11 2026.

What is Tecnoglass Inc (TGLS) market cap?

Today TGLS has the market capitalization of 1.77B USD.