Intellectia LogoIntellectia
Product
Resources
Markets
News
Partner Program
Pricing
Log inTry for Free
Intellectia Logo
Log in
Intellectia Logo

Product

Features
Financial AI Agent
Stock Technical Analysis
Stock Monitor
Hedge Fund Tracker
AI Screener
Trading Strategies
AI Stock Picker
Swing Trading
Quant AI
Stock Chart Patterns
Daytrading Center
AI Earnings Prediction
Whales Auto Tracker
Backtesting Playground

Resources

Learn
Blog
Earnings
Tutorial
Help Center
Company
About Us
Contact
Press
Reward Program
Partner Program
Tools
Dividend Calculator
Dividend Yield Calculator
Options Profit Calculator
Compare
TradingView
SeekingAlpha

Markets

Trending Stocks
Hot Crypto
Trending News
All Stocks

News

Trading News
Overview
Top News
Daily Market Brief
Earnings
Latest
Newswire
Stock News
Crypto News
Monitor News
Partner ProgramPricing
Start for Free
  1. Home
  2. >
  3. Stock
  4. >
  5. TDW
stocks logo

TDW

-
collectAdd to Watchlistadvanced chartAdvanced Chart
$
0.000
0(0.000%)1D
collectadvanced chart
    Overview
    Forecast
    Valuation
    Earnings
High
--
Open
--
VWAP
--
Vol
--
Mkt Cap
--
Low
--
Amount
--
EV/EBITDA(TTM)
--
Total Shares
--
EV
--
EV/OCF(TTM)
--
P/S(TTM)
--
Financial AI Agent
Financial AI Agent

Market Estimates

Earnings Estimates
Earnings Estimates
Revenue
YoY Chg
EPS
YoYChg
FY2025Q4
FY2026Q1
FY2026Q2
331.63M
-3.9%
0.757
+5.9%
323.37M
-3.02%
0.730
-12.61%
332.61M
-2.59%
0.828
-43.42%
Estimates Revision
The market is revising Downward the revenue expectations for Tidewater Inc. (TDW) for FY2025, with the revenue forecasts being adjusted by -0.27% over the past three months. During the same period, the stock price has changed by 3.07%.
Revenue Estimates for FY2025
Revise Downward
down Image
-0.27%
In Past 3 Month
EPS Estimates for FY2025
Revise Downward
down Image
-17.03%
In Past 3 Month
Stock Price
Go Up
up Image
+3.07%
In Past 3 Month
Wall Street analysts forecast TDW stock price to rise over the next 12 months. According to Wall Street analysts, the average 1-year price target for TDW is 65.00 USD with a low forecast of 65.00 USD and a high forecast of 65.00 USD. However, analyst price targets are subjective and often lag stock prices, so investors should focus on the objective reasons behind analyst rating changes, which better reflect the company's fundamentals.
2 Analyst Rating
Wall Street analysts forecast TDW stock price to rise over the next 12 months. According to Wall Street analysts, the average 1-year price target for TDW is 65.00 USD with a low forecast of 65.00 USD and a high forecast of 65.00 USD. However, analyst price targets are subjective and often lag stock prices, so investors should focus on the objective reasons behind analyst rating changes, which better reflect the company's fundamentals.
0 Buy
2 Hold
0 Sell
Hold
Current: 59.500
sliders
Low
65.00
Averages
65.00
High
65.00
Current: 59.500
sliders
Low
65.00
Averages
65.00
High
65.00
Evercore ISI
In Line
downgrade
$67 -> $65
2025-11-12
Reason
Evercore ISI
Price Target
$67 -> $65
2025-11-12
downgrade
In Line
Reason
Evercore ISI lowered the firm's price target on Tidewater to $65 from $67 and keeps an In Line rating on the shares after the company reported "mixed" Q3 results. Tidewater is navigating a transitional phase and early 2026 guidance "feels conservative," but the industry's broader recovery is pivotal, the analyst tells investors.
DNB Carnegie
Buy
to
Hold
downgrade
2025-10-20
Reason
DNB Carnegie
Price Target
2025-10-20
downgrade
Buy
to
Hold
Reason
DNB Carnegie downgraded Tidewater to Hold from Buy.
Fearnley
Magnus Andersen
Buy
to
Hold
downgrade
$65
2025-09-16
Reason
Fearnley
Magnus Andersen
Price Target
$65
2025-09-16
downgrade
Buy
to
Hold
Reason
Fearnley analyst Magnus Andersen downgraded Tidewater to Hold from Buy with a $65 price target.
BTIG
Gregory Lewis
Buy
to
Neutral
downgrade
2025-07-14
Reason
BTIG
Gregory Lewis
Price Target
2025-07-14
downgrade
Buy
to
Neutral
Reason
BTIG analyst Gregory Lewis downgraded Tidewater to Neutral from Buy.
BTIG
Buy -> Neutral
downgrade
2025-07-14
Reason
BTIG
Price Target
2025-07-14
downgrade
Buy -> Neutral
Reason
BTIG downgraded Tidewater to Neutral from Buy as part of a broader research note on Offshore Oil Services names. There has been a flight to quality trade in offshore services over the last year, though the firm still views the ongoing slow down in drilling activity as a pause in the cycle, with 7G utilization still firm and at premium pricing versus 6G floaters, the analyst tells investors in a research note. BTIG adds that 2025 was expected to be a transition year for offshore activity given ongoing macro uncertainty, the drop in the 2026 oil futures curve, and OPEC+ unwinding production cuts, but the firm expects offshore activity to continue to limp along this year and most of next.
Evercore ISI Group
James West
Buy
to
Hold
Downgrades
$112 → $68
2025-01-15
Reason
Evercore ISI Group
James West
Price Target
$112 → $68
2025-01-15
Downgrades
Buy
to
Hold
Reason
See All Ratings

Valuation Metrics

The current forward P/E ratio for Tidewater Inc (TDW.N) is 18.19, compared to its 5-year average forward P/E of 6.31. For a more detailed relative valuation and DCF analysis to assess Tidewater Inc 's fair value, click here.
  • Forward PE
  • Forward EV/EBITDA
  • Forward PS

Forward PE

The forward P/E ratio is a valuation metric that divides a company's current stock price by its estimated future earnings per share over the next 12 months.
StronglyUndervaluedUndervaluedFairOvervaluedStronglyOvervalueddotted line Image
N/A
5Y Average PE
6.31
Current PE
18.19
Overvalued PE
20.63
Undervalued PE
-8.01

Forward EV/EBITDA

The forward EV/EBITDA ratio is a valuation metric that divides a company's enterprise value (EV) by its estimated future earnings before interest, taxes, depreciation, and amortization (EBITDA) over the next 12 months.
StronglyUndervaluedUndervaluedFairOvervaluedStronglyOvervalueddotted line Image
N/A
5Y Average EV/EBITDA
7.33
Current EV/EBITDA
0.00
Overvalued EV/EBITDA
10.79
Undervalued EV/EBITDA
3.87

Forward PS

The forward P/S ratio is a valuation metric that divides a company's current stock price by its estimated future sales (or revenue) per share over the next 12 months.
StronglyUndervaluedUndervaluedFairOvervaluedStronglyOvervalueddotted line Image
N/A
5Y Average PS
1.97
Current PS
0.00
Overvalued PS
2.67
Undervalued PS
1.27
Intellectia AI SwingMax

Financials

Annual
Quarterly
N/A
Total Revenue
N/A
Operating Profit
N/A
Net Income after Tax
N/A
EPS - Diluted
N/A
Free Cash Flow
N/A
Gross Profit Margin - %
N/A
FCF Margin - %
N/A
Net Margin - %
N/A
ROIC

Trading Trends

  • Insider
  • Hedge Fund
  • Congress Trading
Insider
Insiders areSelling! The selling amount has increased 130.18% over the last month.
Sold
Bought
Hedge Fund
Hedge Funds are Neutral. There are no significant trading trends over the last quarter.
Sold
Bought
Congress Trading
Congress are Neutral. There are no significant trading trends over the last month.
Sold
Bought
Insider
Insiders areSelling! The selling amount has increased 130.18% over the last month.
Sold
Bought
AI Stock Picker
AI Stock Picker

TDW News & Events

Events Timeline

(ET)
2025-11-10
16:29:11
Tidewater projects FY26 revenue between $1.32B and $1.37B, below consensus estimate of $1.4B
select
2025-11-10
16:28:34
Tidewater adjusts FY25 revenue forecast to a range of $1.33B-$1.35B, down from $1.32B-$1.38B.
select
2025-11-10
16:27:44
Tidewater announces Q3 earnings per share of 2 cents, down from 87 cents a year ago.
select
Sign Up For More Events

News

[object Object]
Preview
7.0
11-11SeekingAlpha
Tidewater sets 2026 revenue goal of $1.32B-$1.37B amid increasing capital allocation flexibility
  • Management Performance: Tidewater Inc. reported Q3 2025 revenue of $341.1 million, exceeding expectations, with a gross margin of 48%. The company generated strong free cash flow of $83 million, bringing the year-to-date total to nearly $275 million.

  • 2026 Outlook: Management initiated a revenue guidance range for 2026 of $1.32 billion to $1.37 billion, with expectations of 80% utilization and a robust backlog representing 69% of the midpoint of the revenue guidance.

  • Financial Results: Despite a net loss of $806,000 for the quarter, the gross margin was above expectations, attributed to higher day rates and utilization. Operating costs increased due to various factors, including salaries and maintenance.

  • Market Sentiment: Analysts expressed a neutral to slightly positive outlook, with management maintaining a confident tone about long-term prospects while acknowledging short-term headwinds in certain regions and ongoing structural industry risks.

[object Object]
Preview
9.5
11-11NASDAQ.COM
Tidewater Reports Loss for Third Quarter
  • Third-Quarter Financial Performance: Tidewater Inc. reported a third-quarter net loss of $0.8 million or $0.02 per share, a significant decline from a net income of $46.4 million or $0.87 per share in the same quarter last year.

  • Revenue and Gross Margin: The company's revenues for the third quarter were $341.1 million, slightly up from $340.4 million the previous year, with a gross margin of 48.0%.

  • CEO's Insights: CEO Quintin Kneen noted that vessel uptime exceeded expectations, although average day rates softened in certain regions, while other segments experienced meaningful increases.

  • Updated Revenue Guidance: Tidewater updated its 2025 revenue guidance to between $1.33 and $1.35 billion and initiated guidance for 2026 at $1.32 to $1.37 billion.

[object Object]
Preview
9.5
11-11NASDAQ.COM
Earnings Report for November 10, 2025: After-Hours Updates on OXY, RKLB, ASTS, RGTI, SARO, WULF, BLTE, PLUG, MLYS, TDW, BBAI, JAMF
  • Earnings Reports Overview: Several companies, including Occidental Petroleum, Rocket Lab, and StandardAero, are set to report their earnings for the quarter ending September 30, 2025, with varying forecasts and performance expectations.

  • Occidental Petroleum (OXY): Expected to report earnings per share (EPS) of $0.48, a 52% decrease from last year, but has consistently beaten expectations in the past year.

  • Rocket Lab (RKLB) and AST SpaceMobile (ASTS): RKLB forecasts an EPS of -$0.09 (10% increase), while ASTS anticipates -$0.18 (25% increase), both showing improvements compared to the previous year.

  • Other Notable Companies: TeraWulf, Belite Bio, and Plug Power are also reporting, with mixed forecasts; TeraWulf expects -$0.04 (20% increase), while Belite Bio anticipates a significant decrease in EPS by 89.29%.

Sign Up For More News

People Also Watch

FAQ

arrow icon

What is Tidewater Inc (TDW) stock price today?

The current price of TDW is 59.5 USD — it has decreased -0.42 % in the last trading day.

arrow icon

What is Tidewater Inc (TDW)'s business?

Tidewater Inc. is an owner and operator of offshore support vessels providing offshore energy exploration, production and offshore wind activities worldwide. The Company’s segments include Americas, Asia Pacific, Middle East, Europe/Mediterranean and West Africa. Its vessels and associated services support all phases of offshore crude oil and natural gas (also referred to as oil and gas) exploration activities, field development, production and maintenance, as well as windfarm development and maintenance. Its services include transporting supplies and personnel necessary to sustain drilling, workovers, production activities, field abandonment, dismantlement and restoration activities; offshore construction and seismic and subsea support; geotechnical survey support for windfarm construction, and a variety of other specialized services such as pipe and cable laying. It offers a diversified fleet of offshore service vessels, with around 211 vessels serving customers in over 30 countries.

arrow icon

What is the price predicton of TDW Stock?

Wall Street analysts forecast TDW stock price to rise over the next 12 months. According to Wall Street analysts, the average 1-year price target for TDW is 65.00 USD with a low forecast of 65.00 USD and a high forecast of 65.00 USD. However, analyst price targets are subjective and often lag stock prices, so investors should focus on the objective reasons behind analyst rating changes, which better reflect the company's fundamentals.

arrow icon

What is Tidewater Inc (TDW)'s revenue for the last quarter?

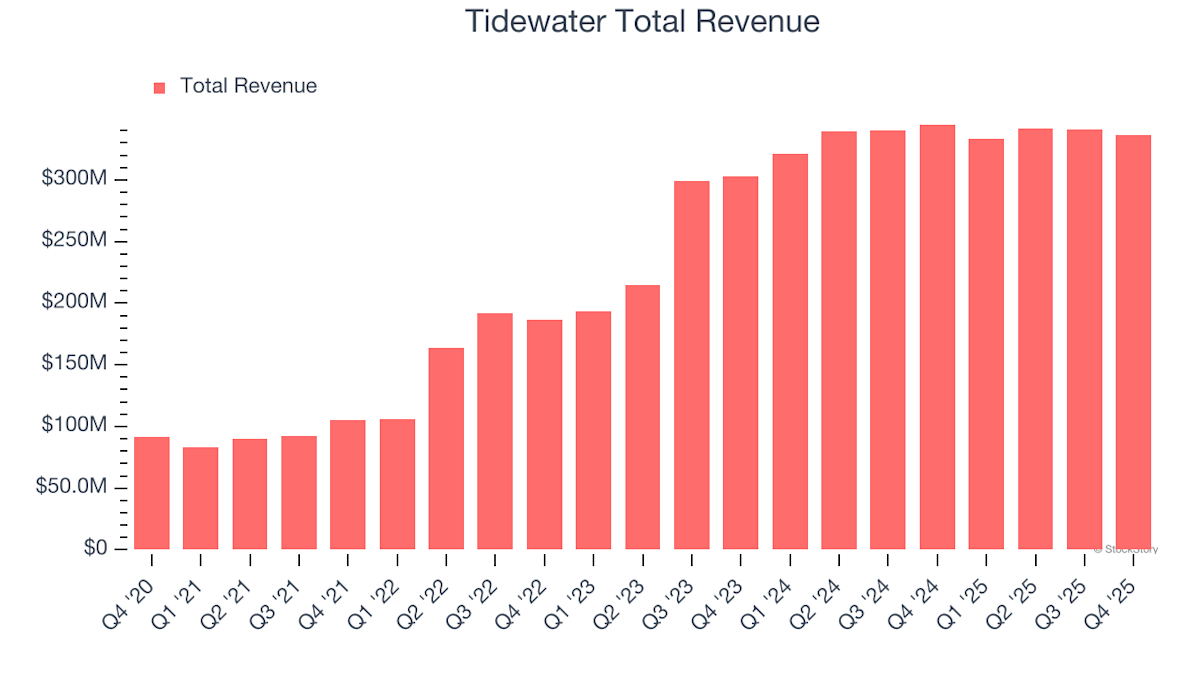
Tidewater Inc revenue for the last quarter amounts to 341.11M USD, increased 0.22 % YoY.

arrow icon

What is Tidewater Inc (TDW)'s earnings per share (EPS) for the last quarter?

Tidewater Inc. EPS for the last quarter amounts to -0.02 USD, decreased -102.30 % YoY.

arrow icon

What changes have occurred in the market's expectations for Tidewater Inc (TDW)'s fundamentals?

The market is revising Downward the revenue expectations for Tidewater Inc. (TDW) for FY2025, with the revenue forecasts being adjusted by -0.27% over the past three months. During the same period, the stock price has changed by 3.07%.
arrow icon

How many employees does Tidewater Inc (TDW). have?

Tidewater Inc (TDW) has 7700 emplpoyees as of December 05 2025.

arrow icon

What is Tidewater Inc (TDW) market cap?

Today TDW has the market capitalization of 2.95B USD.

Intellectia LogoIntellectiaIntellectia LogoIntellectia

Redefine Your Investment Decisions

TwitterTwitterYoutubeYoutubeQuoraQuoraDiscordDiscordLinkedinLinkedinTelegramTelegram
AppStoreGooglePlay

Copyright © 2025 Intellectia.AI. All Rights Reserved.

pci certified logo
Company
HomeContactAbout UsNews Release
Compare
TradingViewSeeking Alpha
Features
Financial AI AgentStock Technical AnalysisStock MonitorHedge Fund TrackerAI ScreenerDaytrading Center
Strategies
AI Stock PickerSwing TradingStock Chart PatternsEarnings TradingDaytrading CenterAI Earnings PredictionQuant AIWhales Auto TrackerBacktesting Playground
Free Tools
Dividend CalculatorDividend Yield CalculatorOptions Profit Calculator
Resource
BlogTutorialEarningsTrending StocksCrypto MarketPartner ProgramTerms of UsePrivacy PolicySecuritySitemap
Start for Free