
SG
Sweetgreen Inc
- Overview
- Forecast
- Valuation
- Earnings

Line
|

Candle
1D
5D
1M
3M
6M
YTD
1Y
5Y
High
10.0797
Open
9.740
VWAP
9.66
Vol
8.28M
Mkt Cap
1.13B
Low
9.415
Amount
79.96M
EV/EBITDA(TTM)
7.89
Total Shares
113.31M
EV
982.93M
EV/OCF(TTM)
54.06
P/S(TTM)
1.65
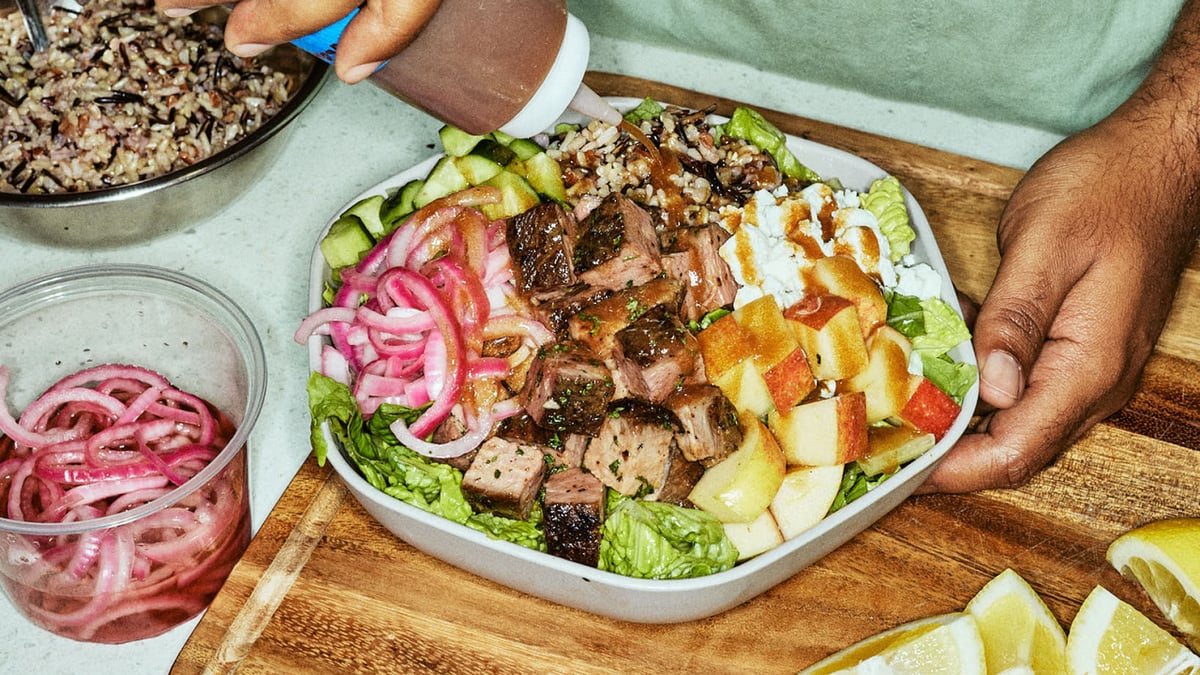
Sweetgreen, Inc. is a restaurant and lifestyle brand that serves healthy food at scale. The Company has designed its menu to be customizable and convenient to empower its customers to make healthier choices for both lunch and dinner. The Company's core menu features approximately 13 signature items which are offered year-round in all of its locations, including its new steak plate. In addition to its core menu items, its single most popular item is the custom salad or bowl, which can include combinations from 40-plus ingredients as well as its made-from-scratch dressings. On its Owned Digital Channels, it offers exclusive menu items, including seasonal digital exclusives and collections relevant to each customer. It has a five-channel model that is designed to help its customers to order. The Company's five-channel model includes Pick-Up, Native Delivery, Outpost and Catering, In-Store, and Marketplace. It has approximately 250 restaurants across the country.
Show More
Market Estimates
Earnings Estimates
Revenue
YoY Chg
EPS
YoYChg
FY2026Q1
FY2025Q4
FY2025Q3
200.10M
+20.32%
--
--
180.71M
+12.31%
--
--
185.46M
+6.94%
--
--
Estimates Revision
The market is revising No Change the revenue expectations for Sweetgreen, Inc. (SG) for FY2025, with the revenue forecasts being adjusted by 0% over the past three months. During the same period, the stock price has changed by -38.75%.
Revenue Estimates for FY2025
No Change

0.00%
In Past 3 Month
Stock Price
Go Down

-38.75%
In Past 3 Month
13 Analyst Rating

98.75% Upside
Wall Street analysts forecast SG stock price to rise over the next 12 months. According to Wall Street analysts, the average 1-year price target for SG is 19.04 USD with a low forecast of 14.50 USD and a high forecast of 29.00 USD. However, analyst price targets are subjective and often lag stock prices, so investors should focus on the objective reasons behind analyst rating changes, which better reflect the company's fundamentals.
6 Buy
7 Hold
0 Sell
Moderate Buy

98.75% Upside
Current: 9.580

Low
14.50
Averages
19.04
High
29.00

98.75% Upside
Current: 9.580

Low
14.50
Averages
19.04
High
29.00
Barclays
Equal Weight
downgrade
$17 -> $10
2025-08-08
New
Reason
Barclays
Price Target
$17 -> $10
2025-08-08
New
downgrade
Equal Weight
Reason
Barclays lowered the firm's price target on Sweetgreen to $10 from $17 and keeps an Equal Weight rating on the shares. The company's Q2 results came in well below expectations top to bottom and its guidance was reduced again, the analyst tells investors in a research note.
Morgan Stanley
Brian Harbour
Equal Weight
downgrade
$17 -> $13
2025-08-08
New
Reason
Morgan Stanley
Brian Harbour
Price Target
$17 -> $13
2025-08-08
New
downgrade
Equal Weight
Reason
Morgan Stanley analyst Brian Harbour lowered the firm's price target on Sweetgreen to $13 from $17 and keeps an Equal Weight rating on the shares. Expectations had been moderating, but the firm thinks guidance being cut "materially" will weigh on the stock, the analyst tells investors. With a number of changes in progress, in-store execution will be "a show-me story," so the firm remains sidelined, the analyst added.
Piper Sandler
Brian Mullan
Neutral
downgrade
$20 -> $12
2025-08-08
New
Reason
Piper Sandler
Brian Mullan
Price Target
$20 -> $12
2025-08-08
New
downgrade
Neutral
Reason
Piper Sandler analyst Brian Mullan lowered the firm's price target on Sweetgreen to $12 from $20 and keeps a Neutral rating on the shares after the company reported earnings. The firm notes that for the quarter, the Q2 same-store sales result of down 7.6% came in below consensus expectations of down 5.5%. While Piper is a big believer in the brand, and doesn't think this means the company can't meaningfully grow from here, it will likely be a tough day for the stock.
UBS
Buy
downgrade
$19 -> $13
2025-08-08
New
Reason
UBS
Price Target
$19 -> $13
2025-08-08
New
downgrade
Buy
Reason
UBS lowered the firm's price target on Sweetgreen to $13 from $19 and keeps a Buy rating on the shares. Pressures persist as the focus shifts to same-store sales improvement, the analyst tells investors in a research note.
RBC Capital
Logan Reich
Outperform -> NULL
downgrade
$25 -> $13
2025-08-08
New
Reason
RBC Capital
Logan Reich
Price Target
$25 -> $13
2025-08-08
New
downgrade
Outperform -> NULL
Reason
RBC Capital analyst Logan Reich lowered the firm's price target on Sweetgreen to $13 from $25 and keeps an Outperform rating on the shares. The company's Q2 results were challenging as the miss and guide-down were "significant", the analyst tells investors in a research note. Sweetgreen is one of the most discretionary occasions in the firm's coverage and hence are likely more sensitive to consumer sentiment, RBC added.
Oppenheimer
Oppenheimer
Outperform
downgrade
$29 -> $18
2025-08-08
New
Reason
Oppenheimer
Oppenheimer
Price Target
$29 -> $18
2025-08-08
New
downgrade
Outperform
Reason
Oppenheimer lowered the firm's price target on Sweetgreen to $18 from $29 and keeps an Outperform rating on the shares. Investors anticipated Sweetgreen to reset 2025 financial guidance, but the magnitude was still tough, the firm says. Oppenheimer believes the company has transitioned to a "show me" story that requires a bottoming and reversal in earnings and evidence that a majority of the sales headwinds and negative operating leverage in 2025 is temporary. The firm moves its 2026 EBITDA forecast to $29M from $57M to provide a much needed reset to its model.
See All Ratings
Valuation Metrics
The current forward P/E ratio for Sweetgreen Inc (SG.N) is -14.70, compared to its 5-year average forward P/E of -25.60. For a more detailed relative valuation and DCF analysis to assess Sweetgreen Inc 's fair value, click here.
Forward PE
The forward P/E ratio is a valuation metric that divides a company's current stock price by its estimated future earnings per share over the next 12 months.

N/A
5Y Average PE
-25.60
Current PE
-14.70
Overvalued PE
-7.46
Undervalued PE
-43.74
Forward EV/EBITDA
The forward EV/EBITDA ratio is a valuation metric that divides a company's enterprise value (EV) by its estimated future earnings before interest, taxes, depreciation, and amortization (EBITDA) over the next 12 months.

N/A
5Y Average EV/EBITDA
115.33
Current EV/EBITDA
52.42
Overvalued EV/EBITDA
460.89
Undervalued EV/EBITDA
-230.22
Forward PS
The forward P/S ratio is a valuation metric that divides a company's current stock price by its estimated future sales (or revenue) per share over the next 12 months.

Undervalued
5Y Average PS
3.56
Current PS
1.48
Overvalued PS
5.36
Undervalued PS
1.76
Financials
Annual
Quarterly
FY2025Q2
YoY :
+0.51%
185.58M
Total Revenue
FY2025Q2
YoY :
+27.89%
-19.84M
Operating Profit
FY2025Q2
YoY :
+60.15%
-23.16M
Net Income after Tax
FY2025Q2
YoY :
+53.85%
-0.20
EPS - Diluted
FY2025Q2
YoY :
+599.02%
-14.94M
Free Cash Flow
FY2025Q2
YoY :
-15.94%
18.09
Gross Profit Margin - %
FY2025Q2
YoY :
+163.74%
-12.00
FCF Margin - %
FY2025Q2
YoY :
+59.39%
-12.48
Net Margin - %
Trading Trends
Insider
Insiders are Neutral. There are no significant trading trends over the last month.
Sold
0-3
Months
0.0
USD
0
3-6
Months
1.3M
USD
10
6-9
Months
37.5M
USD
15
0-12
Months
22.3M
USD
48
Bought
0-3
0
0.0
USD
Months
3-6
1
251.7K
USD
Months
6-9
0
0.0
USD
Months
0-12
0
0.0
USD
Months
Hedge Fund
Hedge Funds are Neutral. There are no significant trading trends over the last quarter.
Sold
0-3
Months
0.0
Volume
0
3-6
Months
0.0
Volume
0
6-9
Months
552.7K
Volume
2
0-12
Months
0.0
Volume
0
Bought
0-3
1
20.0K
Volume
Months
3-6
4
3.5M
Volume
Months
6-9
3
256.8K
Volume
Months
0-12
0
0.0
Volume
Months
Congress Trading
Congress are Neutral. There are no significant trading trends over the last month.
Sold
0-3
Months
0.0
USD
0
3-6
Months
0.0
USD
0
6-9
Months
0.0
USD
0
0-12
Months
0.0
USD
0
Bought
0-3
0
0.0
USD
Months
3-6
0
0.0
USD
Months
6-9
0
0.0
USD
Months
0-12
0
0.0
USD
Months
Insider
Insiders are Neutral. There are no significant trading trends over the last month.
Sold
0-3
Months
0.0
USD
0
3-6
Months
1.3M
USD
10
6-9
Months
37.5M
USD
15
0-12
Months
22.3M
USD
48
Bought
0-3
0
0.0
USD
Months
3-6
1
251.7K
USD
Months
6-9
0
0.0
USD
Months
0-12
0
0.0
USD
Months
SG News & Events
Events Timeline
2025-08-07 (ET)
2025-08-07
16:42:05
Sweetgreen lowers FY25 revenue view to $700M-$715M, consensus $739.82M

2025-08-07
16:40:25
Sweetgreen reports Q2 EPS (20c), consensus (5c)

2025-07-07 (ET)
2025-07-07
11:15:51
Sweetgreen falls after Bloomberg data shows Q2 sales drop

Sign Up For More Events
News
5.0
08-09CNBCFrom Starbucks to Smoothie King, restaurants seek to cash in on consumers' protein frenzy
4.5
08-08NASDAQ.COMStocks Settle Higher on Solid Earnings and Hopes for a Ukraine Peace Deal
6.0
08-08BenzingaUBS Maintains Buy on Sweetgreen, Lowers Price Target to $13
Sign Up For More News
People Also Watch

ALE
ALLETE Inc
65.760
USD
+0.23%

TDS
Telephone and Data Systems Inc
38.690
USD
-0.15%

BHVN
Biohaven Ltd
13.410
USD
-9.02%

MIR
Mirion Technologies Inc
21.310
USD
+1.38%

HHH
Howard Hughes Holdings Inc
70.280
USD
-1.14%

CVCO
Cavco Industries Inc
450.400
USD
-0.84%

NCNO
nCino Inc
26.200
USD
+0.04%

PAYO
Payoneer Global Inc
6.630
USD
-0.15%

FRO
Frontline Plc
18.480
USD
-3.45%

GGB
Gerdau SA
2.960
USD
-1.00%
FAQ

What is Sweetgreen Inc (SG) stock price today?
The current price of SG is 9.58 USD — it has decreased -1.64 % in the last trading day.

What is Sweetgreen Inc (SG)'s business?

What is the price predicton of SG Stock?

What is Sweetgreen Inc (SG)'s revenue for the last quarter?

What is Sweetgreen Inc (SG)'s earnings per share (EPS) for the last quarter?

What changes have occurred in the market's expectations for Sweetgreen Inc (SG)'s fundamentals?

How many employees does Sweetgreen Inc (SG). have?
