$
2.120
0(0.000%)1D
  • Overview
  • Forecast
  • Valuation
  • Earnings
Line
Line
|
Candle
Candle
1D
5D
1M
3M
6M
YTD
1Y
5Y
High
2.120
Open
2.120
VWAP
2.12
Vol
507.00
Mkt Cap
106.63M
Low
2.120
Amount
1.07K
EV/EBITDA(TTM)
31.07
Total Shares
50.00M
EV
367.04M
EV/OCF(TTM)
48.31
P/S(TTM)
0.24
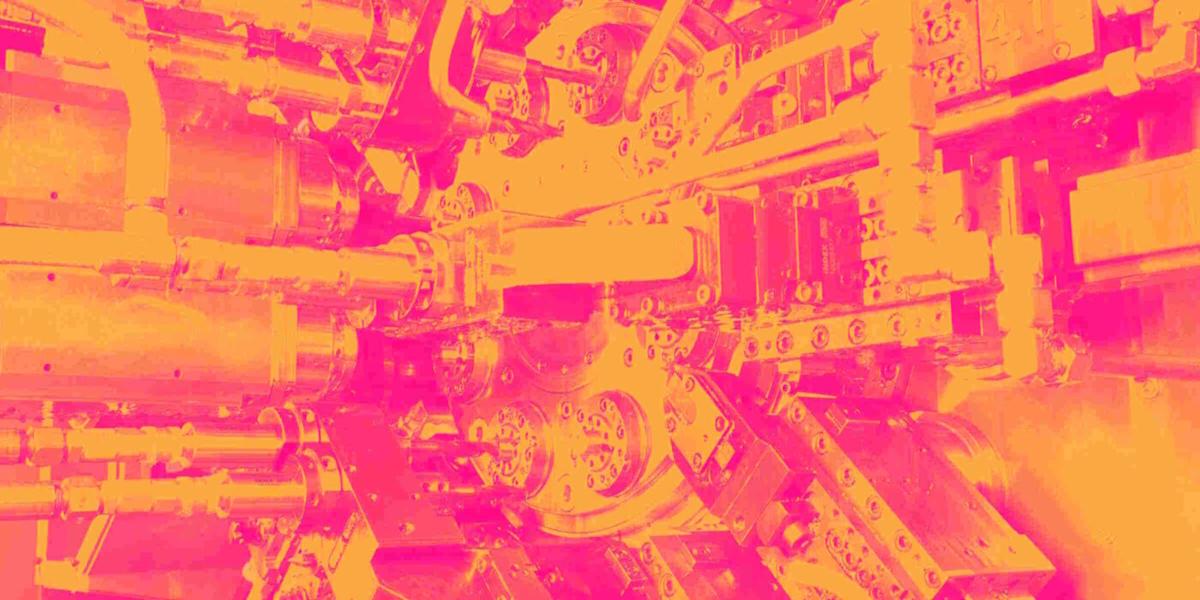
NN, Inc. is a diversified industrial company. The Company combines advanced engineering and production capabilities with materials science expertise to design and manufacture high-precision components and assemblies. The Company operates through two segments: Mobile Solutions and Power Solutions. Mobile Solutions segment manufactures components for use in power steering, braking, transmissions, and gasoline fuel system applications, along with components utilized in heating, ventilation and air conditioning and diesel injection and diesel emissions treatment applications. The segment’s technical capabilities can be utilized in various applications, including for use in battery electric, hybrid electric, and internal combustion engine vehicles. Power Solutions segment manufactures a range of products, including electrical contacts, connectors, contact assemblies, and precision stampings for the electrical end market and high precision products for the aerospace and defense end market.
Show More

Market Estimates

Earnings Estimates
Revenue
YoY Chg
EPS
YoYChg
FY2026Q1
FY2025Q4
FY2025Q3
106.24M
+0.52%
-0.010
-66.67%
108.73M
+2.08%
-0.030
+50%
114.76M
+1.03%
-0.010
-80%
Estimates Revision
The market is revising Downward the revenue expectations for NN, Inc. (NNBR) for FY2025, with the revenue forecasts being adjusted by -1.19% over the past three months. During the same period, the stock price has changed by 12.77%.
Revenue Estimates for FY2025
Revise Downward
down Image
-1.19%
In Past 3 Month
EPS Estimates for FY2025
Revise Upward
up Image
+237.46%
In Past 3 Month
Stock Price
Go Up
up Image
+12.77%
In Past 3 Month
3 Analyst Rating
up Image
151.42% Upside
Wall Street analysts forecast NNBR stock price to rise over the next 12 months. According to Wall Street analysts, the average 1-year price target for NNBR is 5.33 USD with a low forecast of 4.00 USD and a high forecast of 6.00  USD. However, analyst price targets are subjective and often lag stock prices, so investors should focus on the objective reasons behind analyst rating changes, which better reflect the company's fundamentals.
3 Buy
0 Hold
0 Sell
Strong Buy
up Image
151.42% Upside
Current: 2.120
sliders
Low
4.00
Averages
5.33
High
6.00
No Data

Valuation Metrics

The current forward P/E ratio for NN Inc (NNBR.O) is -70.67, compared to its 5-year average forward P/E of -69.71. For a more detailed relative valuation and DCF analysis to assess NN Inc 's fair value, click here.

Forward PE

StronglyUndervaluedUndervaluedFairOvervaluedStronglyOvervalueddotted line Image
N/A
5Y Average PE
-69.71
Current PE
-70.67
Overvalued PE
229.12
Undervalued PE
-368.53

Forward EV/EBITDA

StronglyUndervaluedUndervaluedFairOvervaluedStronglyOvervalueddotted line Image
Fair
5Y Average EV/EBITDA
9.56
Current EV/EBITDA
7.27
Overvalued EV/EBITDA
13.71
Undervalued EV/EBITDA
5.41

Forward PS

StronglyUndervaluedUndervaluedFairOvervaluedStronglyOvervalueddotted line Image
Fair
5Y Average PS
0.35
Current PS
0.25
Overvalued PS
0.51
Undervalued PS
0.18

Financials

Annual
Quarterly
FY2025Q2
YoY :
-12.25%
107.92M
Total Revenue
FY2025Q2
YoY :
-31.81%
-1.46M
Operating Profit
FY2025Q2
YoY :
+136.72%
-10.28M
Net Income after Tax
FY2025Q2
YoY :
+116.67%
-0.26
EPS - Diluted
FY2025Q2
YoY :
-9.32%
-4.42M
Free Cash Flow
FY2025Q2
YoY :
+6.29%
8.62
Gross Profit Margin - %
FY2025Q2
YoY :
-468.97%
-2.14
FCF Margin - %
FY2025Q2
YoY :
+319.55%
-7.51
Net Margin - %

Trading Trends

Insider
Insiders are Neutral. There are no significant trading trends over the last month.
Sold
0-3
Months
0.0
USD
0
3-6
Months
0.0
USD
0
6-9
Months
1.7M
USD
1
0-12
Months
0.0
USD
0
Bought
0-3
0
0.0
USD
Months
3-6
7
255.8K
USD
Months
6-9
0
0.0
USD
Months
0-12
0
0.0
USD
Months
Hedge Fund
Hedge Funds are Neutral. There are no significant trading trends over the last quarter.
Sold
0-3
Months
0.0
Volume
0
3-6
Months
0.0
Volume
0
6-9
Months
0.0
Volume
0
0-12
Months
0.0
Volume
0
Bought
0-3
0
0.0
Volume
Months
3-6
0
0.0
Volume
Months
6-9
0
0.0
Volume
Months
0-12
0
0.0
Volume
Months
Congress Trading
Congress are Neutral. There are no significant trading trends over the last month.
Sold
0-3
Months
0.0
USD
0
3-6
Months
0.0
USD
0
6-9
Months
0.0
USD
0
0-12
Months
0.0
USD
0
Bought
0-3
0
0.0
USD
Months
3-6
0
0.0
USD
Months
6-9
0
0.0
USD
Months
0-12
0
0.0
USD
Months

NNBR News & Events

Events Timeline

2025-08-06 (ET)
2025-08-06
18:49:44
NN, Inc. still sees 2025 revenue $430M-$460M, consensus $443.17M
select
2025-08-06
18:48:51
NN, Inc. reports Q2 adjusted EPS 2c, consensus (0c)
select
2025-07-22 (ET)
2025-07-22
17:47:46
NN appoints Timothy Erro as Chief Commercial Officer
select
Sign Up For More Events

News

9.5
08-06Newsfilter
NN, Inc. Reports Second Quarter 2025 Results
5.0
07-22Newsfilter
NN, Inc. Appoints Tim Erro as New Chief Commercial Officer, Expands New Business Program
1.0
04-30Newsfilter
NN Announces 2025 Investor Day
Sign Up For More News

FAQ

arrow icon

What is NN Inc (NNBR) stock price today?

The current price of NNBR is 2.12 USD — it has increased 0 % in the last trading day.

arrow icon

What is NN Inc (NNBR)'s business?

arrow icon

What is the price predicton of NNBR Stock?

arrow icon

What is NN Inc (NNBR)'s revenue for the last quarter?

arrow icon

What is NN Inc (NNBR)'s earnings per share (EPS) for the last quarter?

arrow icon

What changes have occurred in the market's expectations for NN Inc (NNBR)'s fundamentals?

arrow icon

How many employees does NN Inc (NNBR). have?

arrow icon

What is NN Inc (NNBR) market cap?