Loading...

Intellectia LogoIntellectia
AI Trading Bot
Features
Markets
News
Resources
Pricing
Get Started
  1. Home
  2. Stock
  3. GDRX
GDRX logo

GDRX Overview

-
$
0.000
0.000(0.000%)
At close
0.000(0.000%)Aft-market
ET
$
0.000
0.000(0.000%)
At close
0.000(0.000%)Aft-market
ET
OverviewStock Price PredictionTechnicalValuationFinancialsEarningsShould I BuyNews & Events
an image of Intellectia Logoan image of Intellectia

Most Trusted AI Platform for Winning Trades

TwitterYoutubeQuoraDiscordLinkedinTelegram

Copyright © 2026 Intellectia.AI. All Rights Reserved.

Company

  • Home
  • Contact
  • About Us
  • Press
  • Privacy
  • Terms of Service
  • Service Terms of Use

Resources

  • Blog
  • Tutorial
  • Help Center
  • Affiliate Program

Markets

  • Market Analysis
  • Crypto
  • Featured Screeners
  • AI Earnings Calendar
  • Market Movers
  • Stock Monitor
  • Economic Calendar
  • All US Stocks
  • All Cryptos

Tools

  • Dividend Calculator
  • Dividend Yield Calculator
  • Options Profit Calculator

Features

  • QuantAI Alpha Pick
  • SwingMax Portfolio
  • Swing Trading
  • AI Stock Picker
  • Whales Auto Tracker
  • Daytrading Center
  • Patterns Detection
  • AI Screener
  • Financial AI Agent
  • Backtesting Playground
  • AI Earnings Prediction
  • Stock Monitor
  • Technical Analysis

News

  • Overview
  • Top News
  • Daily Market Brief
  • Earnings Analysis
  • Newswire
  • Stock News
  • Crypto News
  • Institution News
  • Congress News
  • Monitor News

Compare

  • TradingView
  • SeekingAlpha
Intellectia

Loading chart...

High
2.940
Open
2.800
VWAP
2.86
Vol
2.92M
Mkt Cap
988.93M
Low
2.720
Amount
8.36M
EV/EBITDA(TTM)
6.76
Total Shares
338.68M
EV
1.24B
EV/OCF(TTM)
7.28
P/S(TTM)
1.29
GoodRx Holdings, Inc. is a platform for medication savings in the United States, used by consumers and healthcare professionals. The Company connects consumers, healthcare professionals, payers, pharmacy benefit managers (PBMs), pharma manufacturers, and retail pharmacies to make saving on medications easier. The Company's offerings include prescription marketplace and pharma manufacturer solutions. Its prescription marketplace consists of its prescription transactions offering and its supplemental subscription and telehealth offerings. Through its GoodRx Care platform, the Company offers consumers access to telehealth visits on a cash-pay basis outside of insurance. The Company partners with pharma manufacturers to advertise and integrate their affordable solutions into its platform. These solutions, provided by pharma manufacturers, include co-pay cards, patient assistance programs, care portals, and other savings options to ensure consumers can access their medications.
Show More

Events Timeline

(ET)
2026-05-06
17:10:00
GoodRx Q1 Revenue $194M Beats Expectations
select
2026-05-06
17:10:00
Raises FY26 Adjusted EBITDA Outlook to Over $235M
select
2026-05-06
14:50:00
Notable Companies Earnings Consensus: Arm 58c, AppLovin $3.64
select
2026-05-01 (ET)
2026-05-01
08:20:00
GoodRx Offers Novo Nordisk's Ozempic Self-Pay Pricing
select
2026-04-15 (ET)
2026-04-15
09:10:00
GoodRx Launches Novo Nordisk's Wegovy HD at $399 per Month
select
2026-04-09 (ET)
2026-04-09
07:40:00
GoodRx Partners with Eli Lilly to Launch Foundayo
select
2026-03-27 (ET)
2026-03-27
16:50:00
GoodRx Holdings Chief Accounting Officer Resigns
select
2026-03-06 (ET)
2026-03-06
09:10:00
GoodRx Launches Employer-Sponsored Access to Zepbound KwikPen
select

News

NASDAQ.COM
9.5
13:04 PMNASDAQ.COM
PinnedHims & Hers Health Continues to Outperform GoodRx in Revenue Growth
  • Revenue Growth Comparison: Hims & Hers Health has demonstrated consistent revenue growth, with a 59% year-over-year increase in Q4 2025, while GoodRx reported a 4.4% decline in the same period, indicating a stronger competitive position for Hims & Hers in the market.
  • Margin Discrepancy: Hims & Hers Health achieved approximately 72% gross margin in Q4 2025, compared to GoodRx's 21% EBIT margin, reflecting significant operational efficiency and profitability advantages that may attract more investor interest.
  • Market Dynamics Shift: With the average annual cost of family health plans reaching $27,000 in 2026, fewer Americans have access to primary care, providing a strong market tailwind for Hims & Hers Health's alternative platform, further expanding its market share.
  • Investor Focus: GoodRx's Pharma Direct business saw an 82% year-over-year growth in Q1, and while overall revenue stagnated, this segment's performance may capture investor attention, indicating growth potential in specific areas.
Fool
9.5
13:06 PMFool
GoodRx and Hims & Hers Financial Report Analysis
  • GoodRx Revenue Trends: GoodRx reported a 4.4% year-over-year decline in Q1 2026 sales to $194 million, yet its Pharma Direct business surged 82% to $52 million, accounting for 27% of total revenue, indicating potential growth amidst a competitive landscape.
  • Hims & Hers Growth Performance: Hims & Hers achieved a remarkable 59% year-over-year revenue increase in Q4 2025, reaching $617.8 million, alongside a 13% growth in subscribers, showcasing strong demand in the telehealth sector.
  • Market Environment Impact: With the average annual cost of family health plans hitting $27,000 in 2026, fewer Americans have access to primary care, providing robust market support for Hims & Hers' alternative platform, further driving revenue growth.
  • Investor Reaction: GoodRx's stock rose over 10% following its Q1 earnings report, reflecting investor optimism regarding its Pharma Direct business, despite overall revenue stagnation, indicating sustained confidence in future growth prospects.
Yahoo Finance
9.5
13:04 PMYahoo Finance
GoodRx vs Hims & Hers: Revenue Stagnation vs Growth
  • GoodRx Revenue Trends: GoodRx reported a 4.4% year-over-year decline in Q1 2026 sales to $194 million, yet its Pharma Direct business saw an impressive 82% growth, contributing approximately 27% to total revenue, indicating potential amidst stagnation.
  • Hims & Hers Growth Performance: Hims & Hers achieved a remarkable 59% year-over-year revenue increase in Q4 2025, reaching $617.8 million, alongside a 13% growth in subscribers, showcasing its strong market position and consumer appeal.
  • Market Environment Impact: With the average annual cost of family health plans hitting $27,000 in 2026, fewer Americans have access to primary care, creating a robust tailwind for Hims & Hers' alternative platform, further driving its business growth.
  • Investor Considerations: Despite GoodRx's revenue stagnation, the Motley Fool analyst team did not include it in their current top investment stocks list, reflecting a cautious market sentiment regarding its future performance, prompting investors to carefully assess its investment value.
seekingalpha
9.5
05-08seekingalpha
GoodRx Q1 2026 Earnings Call Highlights
  • Significant Revenue Growth: GoodRx reported $194 million in revenue for Q1 2026, with adjusted EBITDA of $58.3 million, achieving a 30% adjusted EBITDA margin, indicating robust execution on profitability.
  • Strong Pharma Direct Growth: GoodRx Pharma Direct experienced an 82% year-over-year growth, with over 125 self-pay programs live, establishing itself as a key growth engine expected to drive future revenue increases.
  • Upward Guidance Revision: CFO McGinnis raised the full-year 2026 revenue guidance to a range of $765 million to $785 million, with adjusted EBITDA expected to be at least $235 million, reflecting optimism about Pharma Direct's performance.
  • Ongoing Prescription Transaction Pressure: Despite a 24% year-over-year decline in prescription transaction revenue to $113.7 million, management views this trend as aligned with internal expectations, emphasizing that growth in Pharma Direct and subscription services will offset this impact.
seekingalpha
9.5
05-06seekingalpha
GoodRx Q1 Earnings Beat Expectations Amid Revenue Decline
  • Earnings Highlights: GoodRx reported a Q1 non-GAAP EPS of $0.07, meeting expectations, while revenue of $194 million, down 4.4% year-over-year, beat forecasts by $8.59 million, indicating resilience in profitability despite challenges.
  • Annual Outlook: Management anticipates FY 2026 revenue between $765 million and $785 million, representing a decline of 1% to 4% from FY 2025's $796.9 million, reflecting intensified market competition and shifts in consumer demand.
  • Adjusted EBITDA Forecast: The company expects adjusted EBITDA to exceed $235 million for FY 2026, showcasing strong cost control capabilities despite revenue pressures, potentially laying the groundwork for future profit growth.
  • Market Reaction: Despite the earnings beat, market sentiment towards GoodRx is waning, indicating a diminishing relevance of its services among consumers, which could impact future user growth and market share.
Newsfilter
8.5
05-01Newsfilter
GoodRx Launches Oral Ozempic® Treatment for Diabetes
  • Transparent Pricing: GoodRx offers Novo Nordisk's Ozempic® oral medication to eligible self-pay patients at a monthly cost starting at $149, significantly reducing financial barriers and enhancing medication accessibility for diabetes patients.
  • Market Expansion Strategy: By introducing the oral Ozempic through its nationwide pharmacy network, GoodRx not only diversifies its medication portfolio but also strengthens its partnership with Novo Nordisk, solidifying its position in the diabetes treatment market.
  • Increased Patient Convenience: The launch of the oral formulation provides patients with a more convenient alternative to traditional injections, which is expected to attract more users and drive growth in GoodRx's user base and market share.
  • Enhanced Industry Influence: This initiative signifies GoodRx's evolution from a pricing solution to a broader consumer access platform, enabling pharmaceutical companies to connect directly with patients and deliver transparent pricing, thereby improving overall healthcare service efficiency.
Wall Street analysts forecast GDRX stock price to rise
10 Analyst Rating
Wall Street analysts forecast GDRX stock price to rise
4 Buy
4 Hold
2 Sell
Hold
Current: 0.000
sliders
Low
2.60
Averages
4.46
High
7.00
Current: 0.000
sliders
Low
2.60
Averages
4.46
High
7.00
Goldman Sachs
Eric Sheridan
Neutral
maintain
AI Analysis
2026-05-08
New
Reason
Goldman Sachs
Eric Sheridan
Price Target
AI Analysis
2026-05-08
New
maintain
Neutral
Reason
Goldman Sachs analyst Eric Sheridan raised the firm's price target on GoodRx to $3.50 from $2.50 and keeps a Neutral rating on the shares.
Wells Fargo
Overweight
downgrade
$7
2026-03-04
Reason
Wells Fargo
Price Target
$7
2026-03-04
downgrade
Overweight
Reason
Wells Fargo lowered the firm's price target on GoodRx to $3.50 from $7 and keeps an Overweight rating on the shares. The firm acknowledges that unexpected take-rate reset reflects structural headwinds for Prescription Tx, but it also supports Pharma Direct's growth formula. Near-term growth and margins are pressured, Wells argues.
Unlock Full Analyst Thesis, Get the complete breakdown of rating reason for GDRX
Unlock Now

Valuation Metrics

The current forward P/E ratio for GoodRx Holdings Inc (GDRX.O) is 5.44, compared to its 5-year average forward P/E of 57.80. For a more detailed relative valuation and DCF analysis to assess GoodRx Holdings Inc's fair value, Click here.

Forward PE

The forward P/E ratio is a valuation metric that divides a company's current stock price by its estimated future earnings per share over the next 12 months.
StronglyUndervaluedUndervaluedFairOvervaluedStronglyOvervalueddotted line Image
N/A
5Y Average PE
57.80
Current PE
5.44
Overvalued PE
669.38
Undervalued PE
-553.79

Forward EV/EBITDA

The forward EV/EBITDA ratio is a valuation metric that divides a company's enterprise value (EV) by its estimated future earnings before interest, taxes, depreciation, and amortization (EBITDA) over the next 12 months.
StronglyUndervaluedUndervaluedFairOvervaluedStronglyOvervalueddotted line Image
5Y Average EV/EBITDA
16.82
Current EV/EBITDA
3.33
Overvalued EV/EBITDA
32.99
Undervalued EV/EBITDA
0.65

Forward PS

The forward P/S ratio is a valuation metric that divides a company's current stock price by its estimated future sales (or revenue) per share over the next 12 months.
StronglyUndervaluedUndervaluedFairOvervaluedStronglyOvervalueddotted line Image
N/A
5Y Average PS
5.01
Current PS
1.19
Overvalued PS
10.14
Undervalued PS
-0.12

Financials

AI Analysis
Annual
Quarterly

Related Community Screener

what short term stocks to buy now
Intellectia · 72 candidates
Region: USRsi Category: moderateBeta: LowRisk, ModerateRisk, HighRisk, NegativeBetaList Exchange: XNYS, XNASMoving Average Relationship: PriceAboveMA20Week Price Change Pct: $6.00 - $20.00Monthly Average Dollar Volume: >= 4,000,000
Ticker
Name
Market Cap$
top bottom
IOT logo
IOT
Samsara Inc
20.40B
CAPR logo
CAPR
Capricor Therapeutics Inc
1.52B
UPXI logo
UPXI
Upexi Inc
62.78M
KC logo
KC
Kingsoft Cloud Holdings Ltd
3.62B
WGS logo
WGS
GeneDx Holdings Corp
2.58B
REPL logo
REPL
Replimune Group Inc
666.36M
stocks under $5 for likely day trade today
Intellectia · 70 candidates
Price: $0.50 - $5.00Price Change Pct: $3.00 - $20.00Relative Vol: >= 1.50List Exchange: XNYS, XNAS, XASEMoving Average Relationship: PriceAboveMA20Monthly Average Dollar Volume: >= 1,000,000
Ticker
Name
Market Cap$
top bottom
CIG logo
CIG
Energy of Minas Gerais Co
6.52B
TUYA logo
TUYA
Tuya Inc
1.42B
ODV logo
ODV
Osisko Development Corp
1.15B
GERN logo
GERN
Geron Corp
1.13B
SANA logo
SANA
Sana Biotechnology Inc
1.08B
OLPX logo
OLPX
Olaplex Holdings Inc
1.07B
I need bullish tech stocks for a week
Intellectia · 33 candidates
Sector: Financial Technology (Fintech) & Infrastructure, Software & IT Services, Technology, Technology Equipment, Telecommunications ServicesIndustry: Communications & Networking, Electronic Equipment & Parts, Electric Utilities & IPPs, Integrated Hardware & Software, Semiconductors & Semiconductor Equipment, Software & IT ServicesRegion: USList Exchange: XNYS, XNAS, XASEMoving Average Relationship: PriceAboveMA20Week Price Change Pct: $2.00 - $20.00One Week Rise Prob: 60 - 100One Week Predict Return: 0.0% - 100.0%
Ticker
Name
Market Cap$
top bottom
AEHR logo
AEHR
Aehr Test Systems
1.03B
UCTT logo
UCTT
Ultra Clean Holdings Inc
2.68B
CREX logo
CREX
Creative Realities Inc
36.82M
JBL logo
JBL
Jabil Inc
28.63B
LITE logo
LITE
Lumentum Holdings Inc
47.68B
PDD logo
PDD
PDD Holdings Inc
148.98B
best penny stocks to buy short term
Intellectia · 30 candidates
Market Cap: <= 1000.00MRegion: USPrice: $0.50 - $5.00List Exchange: XNYS, XNAS, XASEWeek Price Change Pct: $5.00 - $50.00One Week Rise Prob: >= 60Monthly Average Dollar Volume: >= 500,000
Ticker
Name
Market Cap$
top bottom
NIU logo
NIU
NIU Technologies
265.08M
GTEC logo
GTEC
Greenland Technologies Holding Corp
18.96M
AMC logo
AMC
AMC Entertainment Holdings Inc
759.16M
ENLV logo
ENLV
Enlivex Therapeutics Ltd
275.36M
ESLA logo
ESLA
Estrella Immunopharma Inc
60.95M
PLX logo
PLX
Protalix Biotherapeutics Inc
232.42M
best penny stocks to buy
Intellectia · 45 candidates
Market Cap: 50.00M - 1000.00MRegion: USPrice: $0.20 - $5.00Eps Ttm: >= 0Beta: ModerateRisk, HighRiskList Exchange: XNYS, XNAS, XASEMonthly Average Dollar Volume: >= 500,000
Ticker
Name
Market Cap$
top bottom
HIVE logo
HIVE
HIVE Digital Technologies Ltd
695.26M
REI logo
REI
Ring Energy Inc
246.60M
GAU logo
GAU
Galiano Gold Inc
691.04M
LDI logo
LDI
loanDepot Inc
726.45M
ITRG logo
ITRG
Integra Resources Corp
671.92M
MVST logo
MVST
Microvast Holdings Inc
859.84M
penny stock to buy for data center AI
Intellectia · 3 candidates
Market Cap: <= 2.00BPrice: <= $5.00Themes: AI Beneficiary, US Well-Known Retailers, Education & Training Services, Pharmaceutical Retailers, Airlines, Movie and Entertainment, BlockchainWeekly Average Turnover: >= 1,000,000
Ticker
Name
Market Cap$
top bottom
GDRX logo
GDRX
GoodRx Holdings Inc
875.74M
HIVE logo
HIVE
HIVE Digital Technologies Ltd
768.63M
CHGG logo
CHGG
Chegg Inc
83.36M
stocks under $5 today worth buying
Intellectia · 41 candidates
Market Cap: >= 300.00MPrice: <= $5.00Beta: ModerateRiskWeekly Average Turnover: >= 1,000,000Rsi 14: 30 - 70
Ticker
Name
Market Cap$
top bottom
WIT logo
WIT
Wipro Ltd
27.24B
LPL logo
LPL
LG Display Co Ltd
4.32B
CSAN logo
CSAN
Cosan SA
4.02B
COTY logo
COTY
Coty Inc
2.85B
RLX logo
RLX
RLX Technology Inc
2.75B
BTE logo
BTE
Baytex Energy Corp
2.64B

Whales Holding GDRX

S
Silver Lake Technology Management, L.L.C.
Holding
GDRX
+70.49%
3M Return
T
TCMI Inc.
Holding
GDRX
-11.44%
3M Return

Trading Trends

    Insider
    Hedge Fund
    Congress Trading

People Also Watch

Frequently Asked Questions

What is GoodRx Holdings Inc (GDRX) stock price today?

The current price of GDRX is 2.92 USD — it has increased 2.82

What is GoodRx Holdings Inc (GDRX)'s business?

GoodRx Holdings, Inc. is a platform for medication savings in the United States, used by consumers and healthcare professionals. The Company connects consumers, healthcare professionals, payers, pharmacy benefit managers (PBMs), pharma manufacturers, and retail pharmacies to make saving on medications easier. The Company's offerings include prescription marketplace and pharma manufacturer solutions. Its prescription marketplace consists of its prescription transactions offering and its supplemental subscription and telehealth offerings. Through its GoodRx Care platform, the Company offers consumers access to telehealth visits on a cash-pay basis outside of insurance. The Company partners with pharma manufacturers to advertise and integrate their affordable solutions into its platform. These solutions, provided by pharma manufacturers, include co-pay cards, patient assistance programs, care portals, and other savings options to ensure consumers can access their medications.

What is the price predicton of GDRX Stock?

Wall Street analysts forecast GDRX stock price to rise over the next 12 months. According to Wall Street analysts, the average 1-year price target for GDRX is4.46 USD with a low forecast of 2.60 USD and a high forecast of 7.00 USD. However, analyst price targets are subjective and often lag stock prices, so investors should focus on the objective reasons behind analyst rating changes, which better reflect the company's fundamentals.

What is GoodRx Holdings Inc (GDRX)'s revenue for the last quarter?

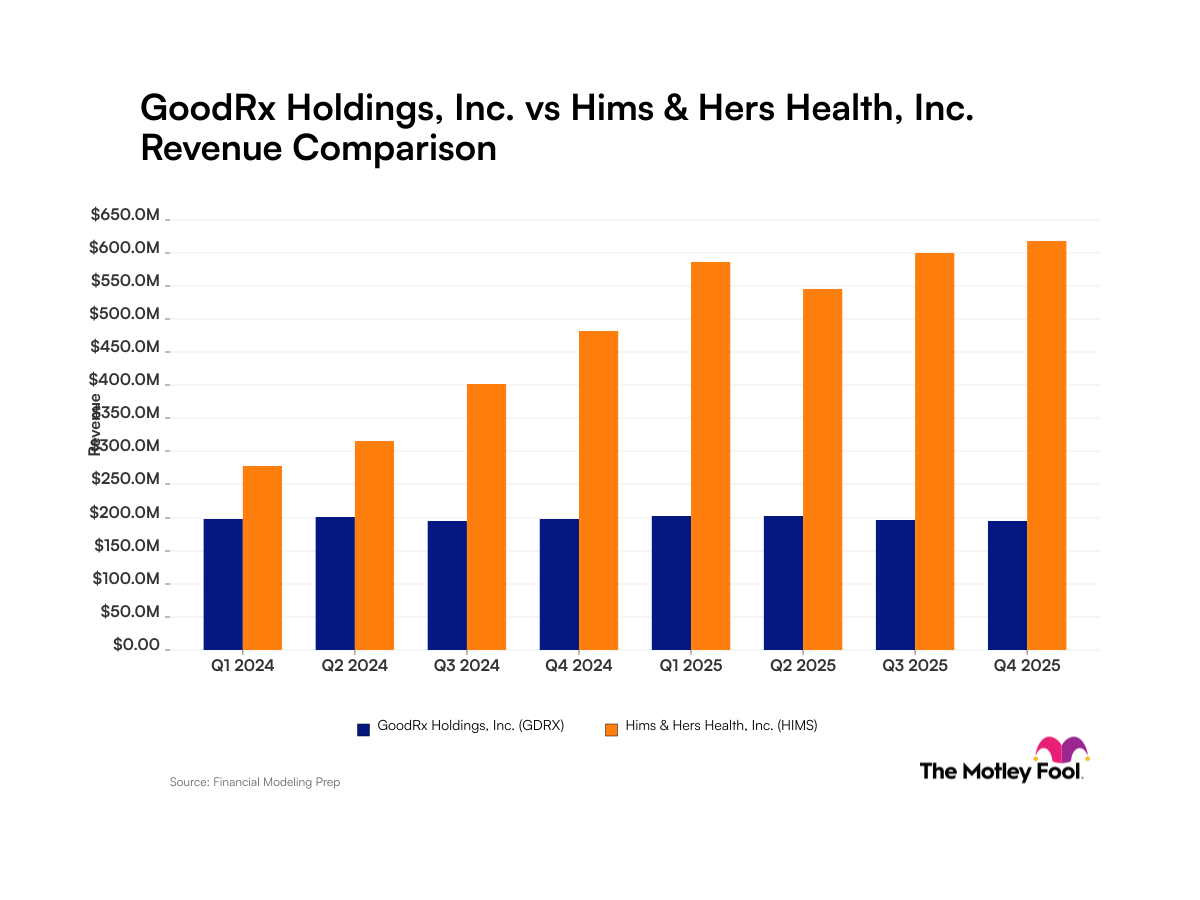
GoodRx Holdings Inc revenue for the last quarter amounts to 194.01M USD, decreased -4.42

What is GoodRx Holdings Inc (GDRX)'s earnings per share (EPS) for the last quarter?

GoodRx Holdings Inc. EPS for the last quarter amounts to 0.04 USD, increased 33.33

How many employees does GoodRx Holdings Inc (GDRX). have?

GoodRx Holdings Inc (GDRX) has 697 emplpoyees as of May 10 2026.

What is GoodRx Holdings Inc (GDRX) market cap?

Today GDRX has the market capitalization of 988.93M USD.